
Damage Detection for Offshore Platform by Wavelet Transform
2010-12-13 02:56LIDongshengZHANGZhaodeWANGDeyu
船舶力学 2010年3期
LI Dong-sheng,ZHANG Zhao-de,WANG De-yu
(1 State Key Laboratory of Ocean Engineering,Shanghai Jiao Tong University,Shanghai 200030,China;2 Zhejiang Ocean University,Zhoushan 316000,China)
1 Introduction
Offshore platform is composed of large numbers of beams.And most beams are below the sea surface.The load and boundary condition of the structures are often changing with complexity.The existence of damage(usually the damage is fatigue cracks)in an offshore structure may lead to changes in the dynamic parameters of the structure,which,in turn,can be utilized to detect,locate and quantify the crack.A direct,fast and inexpensive method is therefore required to evaluate and localize crack using the change in dynamic parameters between the intact and cracked structures.
Viero and Roitman[1]analyzed the effect of beam breackage to frequencies and modal assurance criteria by using experiments of two models,of which the similarity ratio are 1:85 and 1:45 respectively.Rogers,Monk and Paulling[2-5]numerically and experimentally analyzed dynamic behaviours of offshore structures.Yong,Hoon and Ken[6-8]detected cracks in structures using time domain response.Lueck[9]analyzed the dynamic response of platform using wavelet method.Thyagarajan et al[10]analyzed the strategy of diagnosing damage in a truss bridge using FRF from a minimum number of sensors.
Many researchers studied the method of identifying breakage of beams in offshore structure through dynamic parameters.Coppolino and Rubin[11]instrumented the platform at 17 locations for detection of its ambient vibrations.Kim and Bartkowicz[12]described the damage detection study results using a partially instrumented truss.
When early crack occurs,modal parameters and dynamic characteristics may change subtly.So it is important to find cracks in early stage before the breakage of the beam.Early cracks cannot be easily detected,because the shift of dynamic parameter due to early crack is too low to be detected easily.Thus,the wavelet transform can be utilized to magnify the alteration of the dynamic characteristics,to find the singularity of the signal,when an early crack occurs.This paper gives illustration of detecting early cracks in a 3-leg platform by using wavelet transform for FRF data and acceleration response history.This new method can find early crack at α=0.1 in structure of the jacket platform.A steel model test is carried out to verify the proposed method.
2 FEM model
The FEM model is based on 3-leg jacket platform in Bohai Gulf.The jacket is 14.8m high.The jacket structure is shown in Fig.1.The Young’s modulus of steel is 205GPa,and Poisson’s ratio is 0.3,the material density is ρ=7 800kg/m3,the structure damp ratio is ξ15Hz=0.002,ξ60Hz=0.001.
Assume that a crack occurs at one of the following two locations:

Fig.1 FEM model of the jacket
(1)Crack 1:end N of diagonal beam NL;
(2)Crack 2:end N of horizontal beam NP.
Also assume the crack surface is perpendicular to the axis of the beam.Dimensional decrease of the beam cross-section is used to simulate the crack.The assumed damage is a crack with a flat surface.To depict the extent of the damage,a parameter α,called damage ratio,is defined as,
where A and Acare the cross-section area of the beam and the crack area respectively.
The first three modes are calculated numerically by using NASTRAN Code,as shown in Fig.2.And FRF can also be calculated.Subsequently,time domain response of top nodes’acceleration can be obtained.
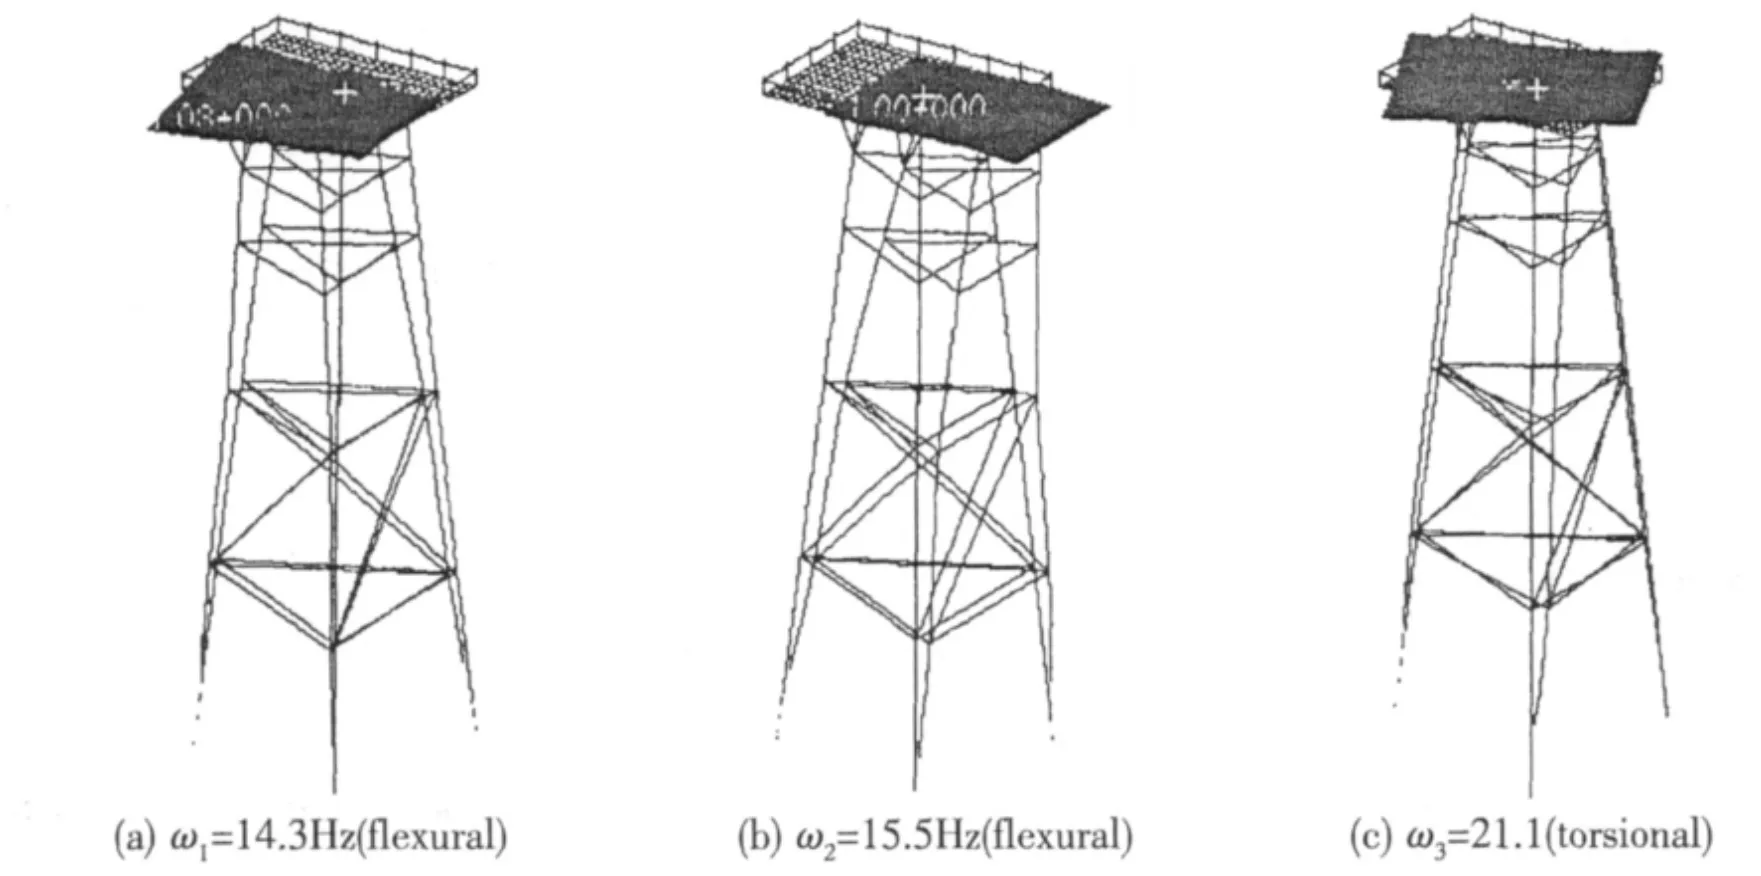
Fig.2 The lowest three modes of the jacket
3 Experiment model
One model was constructed for the observation of its dynamic behavior in the air.It is a 1:8 scaled model of the prototype.It is shown in Fig.3

Fig.3 The test model of the jacket

Fig.4 Data acquisition and processing system of the jacket
The beam is cut to simulate the crack,as shown in Fig.3.Crack at Position 1 and Position 2 was imposed in the jacket model at different magnitude from α=0.01 to 1.0.An impulse force is applied to the model by the shaker LING 450 at point B.Twelve points,that is E,F,G,H,I,J,K,L,M,N,O and P,were selected to measure the responses of the model.Two accelerometers(PCB333B32)were installed at each point to measure the acceleration in the two horizontal directions.And LMS CADA―X3.5D software is used to analyze the data.The data acquisition and processing system is shown in Fig.4.
4 Data processing and results
When crack occurs at Position 1 or Position 2 at a crack ratio of α=0,0.1,0.25,0.5,0.75 or 1,accelerations of the 12 nodes are obtained in the model test.And the lowest three frequencies and FRF can also be calculated,using the experimental data.
4.1 Frequency shift
The lowest three frequencies can also be calculated by the FEM model,using NASTRAN code.When crack 1 occurs at different extent,the calculated frequency shift and the measured frequency shift are obtained,as shown in Fig.5 to Fig.7.When crack 2 occurs,the calculated frequency shift and the measured frequency shift are shown in Fig.8 to Fig.10.
Good correlation,between the numerical frequencies and the experimental ones,can be seen in these figures.The average relative error between the measured and calculated data is about 10%.The reasons that make this error maybe:(1)The simplification of the jacket’s boundary condition;(2)The manufacturing errors of the jacket model.

Fig.5 Measured and calculated 1st frequenc(crack 1)
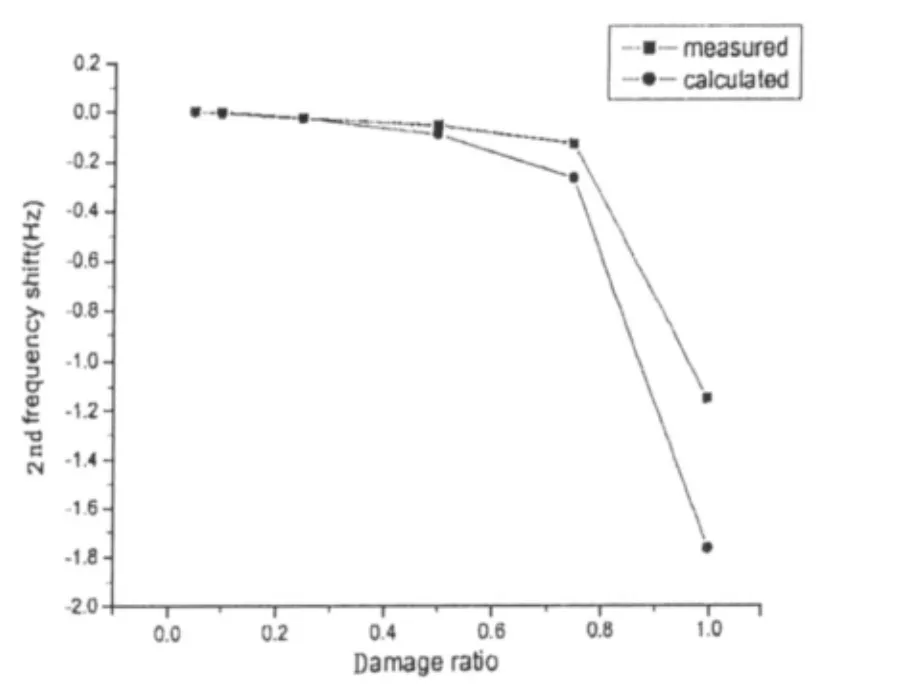
Fig.6 Measured and calculated 2nd frequency(crack 1)

Fig.7 Measured and calculated 3rd frequenc(crack 1)

Fig.8 Measured and calculated 1st frequency(crack 2)
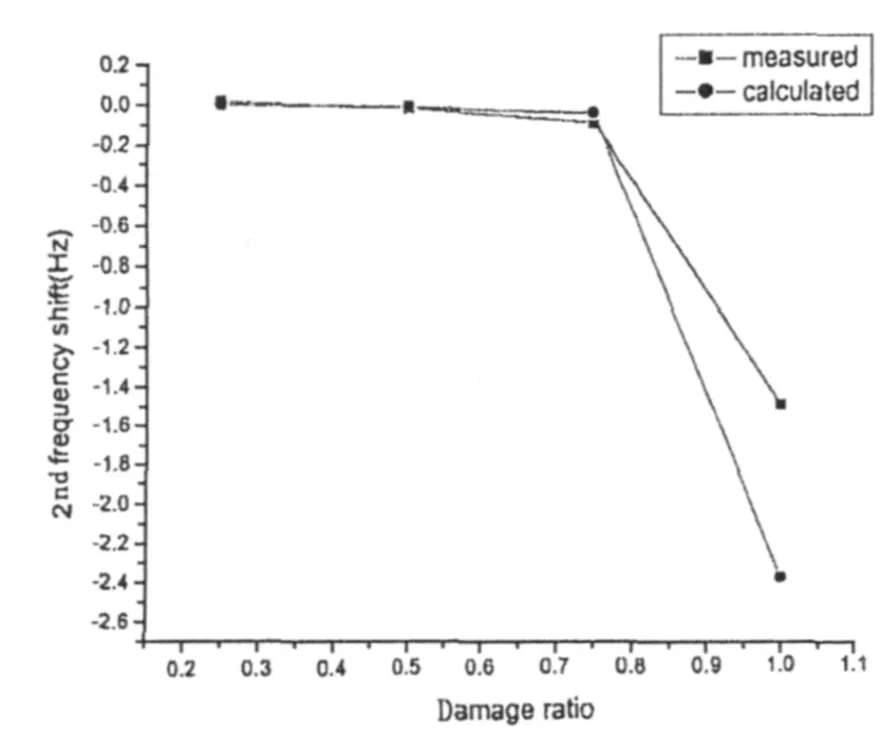
Fig.9 Measured and calculated 2nd frequency(crack)

Fig.10 Measured and calculated 3rd frequency(crack 2)
4.2 FRF-based crack detection
Frequency Response Function can reflect the characteristics of the system.When a crack occurs,the FRF of the structure will change.This shift can be used to predict cracks.
The structure was activated at B by shaker LING 450.When the jacket is uncracked,the FRF(input at B and output at F)can be obtained.When crack occurs at a ratio of α=0.1,0.25,0.5,0.75 and 1,also the FRF can be recorded.The acceleration FRF is shown in Fig.11.
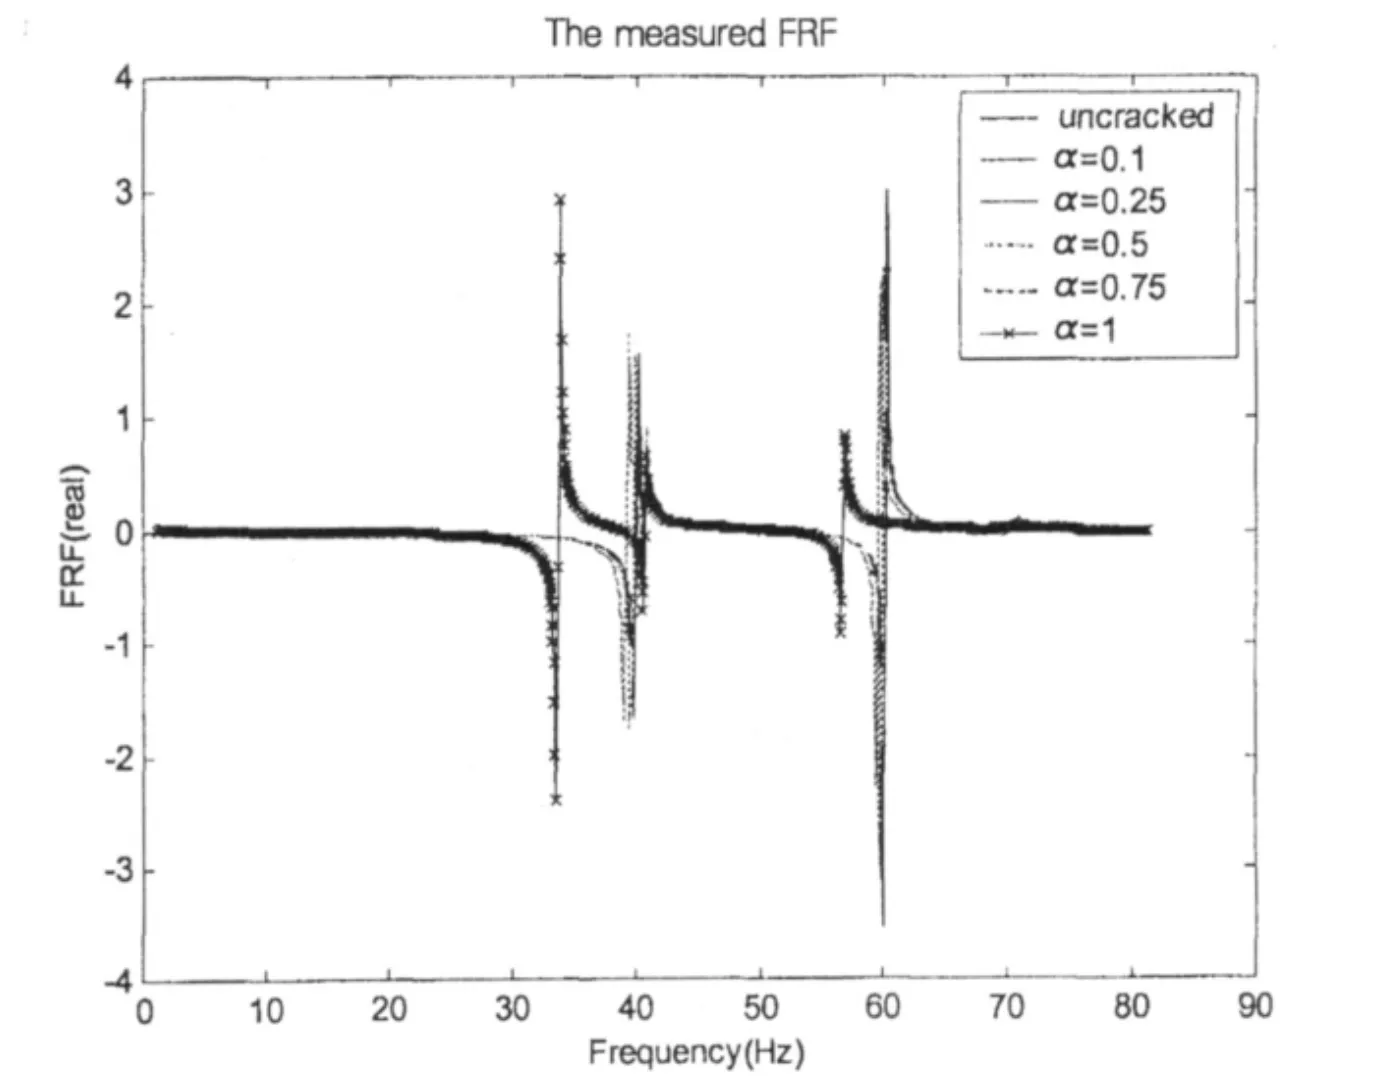
Fig.11 FRF shift when crack 1 occurs
It is shown that FRF of the structure changes minutely when an early crack occurs.Only when the beam breaks,the FRF of the jacket changes evidently.Thus,the FRF can be used to detect any breakage of the beam in the structure.But it cannot be used to predict early cracks in the underwater members,or even to locate the early crack.
5 Dmage detection based on the wavelet transform
5.1 Wavelet transform of FRF
When early crack occurs,dynamic parameters of the offshore structure shift subtly.The change rate is too low to be used to detect the crack directly.Thus,wavelet transform can be used to find the singularity of the signal,so as to predict the crack in the structure.The measured FRF is transformed with continuous wavelet.Daubechies 4 wavelet is used as the mother wavelet.
When a α=0.1 crack occurs at Position 1,the FRF shift of the offshore platform is shown in Fig.12.The abscissa in the figure denotes frequency,while y-axis denotes the scales of the wavelet transform.The scale of colors from pale to deep denotes the wavelet coefficients from minimum to maximum.
It is shown that the wavelet coefficients represent an evident strangeness at every peak of the first three frequencies.And when the crack ratio increases,the irregularity of the wavelet coefficients also increases.Thus,a crack of α=0.1 can be detected by using the continuous wavelet transform of the FRF-data.

Fig.12 The continuous wavelet transform of FRF(crack 1,α=0.1)
5.2 Wavelet transform of acceleration
Time domain response,measured by the accelerometers at Point F in Y direction,is analyzed as an input signal.The analysis period is 1.6~3.2s.The sampling point number is 1 024.Daubechies-6 wavelet is used as the mother wavelet.And 6-layer multi-resolution analysis is proceeded.The decompostion formula is

where s is the original signal,aiand diare the lower part and the higher part of the ith layer of the wavelet transform respectively.
The wavelet transform coefficients are shown in Fig.13,when the structure has no crack.In the figure,he abscissa denotes time,while y-axis denotes the wavelet transform coefficient at different scales.
When a crack of α=0.1 at Position 1 occurs,the multi-resolution wavelet transform results are shown in Fig.14.The difference of wavelet transform between α=0 and α=0.1 can be evidently seen at the higher part of the sixth layer(d6).This singularity of wavelet coefficients can be used to predict the occurrence of early cracks.
When the crack ratio increases,the singularity of the wavelet coefficients becomes more distinct.If different wavelets are chosen as the wavelet mother function,the wavelet transform results will be different.The Daubechies-6 wavelet can be efficiently used to find the singularity of the wavelet coefficients in the multi-resolution wavelet transform analysis.

Fig.13 Wavelet transform of acceleration at F of the uncracked jacket(db6)
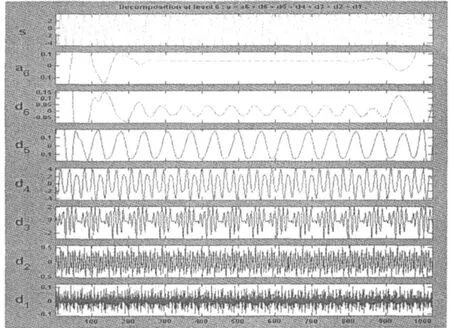
Fig.14 Wavelet transform of acceleration at F of the jacket cracked at α=0.1(db6)
6 Conclusions
Natural frequency can be easily measured,but it can only detect breakage of beams in the structure.Mode shape can provide more information of the crack.It can be used to predict the location and the magnitude of the crack.But it needs a large number of survey points to obtain the modal shapes.FRF-data can be used to detect any breakage of beam in the offshore structure.
Wavelet transform can be used to find the singularity of the signal,such as FRF data and acceleration response,so as to predict early cracks in the structure.An optimized mother wavelet is chosen for the early crack detection in the offshore structure using FRF data or acceleration signal.A crack of α=0.1 in the bottom of the structure can be detected by wavelet transform of the FRF or the acceleration signal.
Finally,it can be concluded that the wavelet transform is a very useful way to detect the initial small damage.
Acknowledgements
This work is supported by(1)National Natural Science Foundation of China(No.50379025);(2)Teaching and Research Award Program(2002)for Outstanding Young Teachers in Higher Education Institutions of Ministry of Education,P.R.China.
[1]Viero P F.Application of some damage identification methods in offshore platforms[J].Marine Structures,1999,12(2):107-126.
[2]Sinha J K.Friswell M I.Simulation of the dynamic response of a cracked beam[J].Computers and Structures,2002,80:1473-1476.
[3]Hermans L,Van Der Auweraer H.Modal testing and analysis of structures under operational conditions:Industrial applications[J].Mechanical Systems and Signal Processing,1999,13(2):193-216.
[4]Gawronski W.Structural damage detection using modal norms[J].Journal of Sound and Vibration,2000,229(1):194-198.
[5]Rogers L M,Monk R G.Detection and monitoring of cracks in offshore structures[C].OTC 5554,1987.
[6]Gao Yong.Flexibility-based damage localization employing ambient vibration[C]//15th ASCE Engineering Mechanics Conference.Columbia Univ.,New York,2002:2-5.
[7]Ken Fyfe,Thoma J U,ismail F.Structural identification from time domain simulations[C]//Proceedings of the 6th International Modal Analysis Conference.Kissimmee,FL,1988.
[8]Sohn H,Farrar C R.Damage diagnosis using time series analysis of vibration signals[J].Smart Materials and Structures,2001(10):1-6.
[9]Lueck R G,Driscoll F R.A wavelet for predicting the time-domain response of vertically tethered systems[J].Ocean Engineering,2000,27(12):1441-1453.
[10]Thyagarajan S K,Schulz M J,Pai P F.Detecting structural damage using frequency response functions[J].Journal of Sound and Vibration,1998,210(1):162.
[11]Coppolino R N,Rubin S.Detectability of structural failures in offshore platforms by ambient vibration monitoring[C].OTC 3865,1980:101.
[12]Kim H M,Bartkowicz T J.An experimental study for damage detection using a hexagonal truss[J].Computers and Structures,2001,79(2):173.

- 船舶力学的其它文章
- Generation and Propagation of Nonlinear Surface Waves in a Fully-Nonlinear Wave Flume
- Nonlinear Model Predictive Controller Design for Path Following of Underactuated Ships
- Dynamic Modeling and Optimization Design on Underwater Gliders
- Factors Affecting the Slamming Pressure Peak Value of Trimaran Cross Structure
- Influence of Force on the Electromagnetic Property of FSS with Apertures
- Study on Multi-objective Optimization and Multi-attribute Decision Making of Dynamic Vibration Absorber