
Single-cell RNA sequencing analysis of the retina under acute high intraocular pressure
2024-03-05 08:49ShaojunWangSitiTongXinJinNaLiPingxiuDangYangSuiYingLiuDajiangWang
中国神经再生研究(英文版) 2024年11期
Shaojun Wang ,Siti Tong ,Xin Jin ,Na Li ,Pingxiu Dang,Yang Sui,Ying Liu,Dajiang Wang,*
Abstract High intraocular pressure causes retinal ganglion cell injury in primary and secondary glaucoma diseases,yet the molecular landscape characteristics of retinal cells under high intraocular pressure remain unknown.Rat models of acute hypertension ocular pressure were established by injection of cross-linked hyaluronic acid hydrogel (Healaflow®).Single-cell RNA sequencing was then used to describe the cellular composition and molecular profile of the retina following high intraocular pressure.Our results identified a total of 12 cell types,namely retinal pigment epithelial cells,rod-photoreceptor cells,bipolar cells,Müller cells,microglia,cone-photoreceptor cells,retinal ganglion cells,endothelial cells,retinal progenitor cells,oligodendrocytes,pericytes,and fibroblasts.The single-cell RNA sequencing analysis of the retina under acute high intraocular pressure revealed obvious changes in the proportions of various retinal cells,with ganglion cells decreased by 23%.Hematoxylin and eosin staining and TUNEL staining confirmed the damage to retinal ganglion cells under high intraocular pressure.We extracted data from retinal ganglion cells and analyzed the retinal ganglion cell cluster with the most distinct expression.We found upregulation of the B3gat2 gene,which is associated with neuronal migration and adhesion,and downregulation of the Tsc22d gene,which participates in inhibition of inflammation.This study is the first to reveal molecular changes and intercellular interactions in the retina under high intraocular pressure.These data contribute to understanding of the molecular mechanism of retinal injury induced by high intraocular pressure and will benefit the development of novel therapies.
Key Words: apoptosis;axon degeneration;high intraocular pressure;microglia;ocular hypertension;photoreceptor cells;retina;retinal degeneration;retinal ganglion cells;single-cell RNA sequencing
Introduction
Glaucoma is an irreversible disease characterized by progressive optic nerve degeneration,and which poses a severe threat to vision globally (Bariş and Tezel,2019).High intraocular pressure (HOP) is the main risk factor for glaucoma(Quigley and Broman,2006),following sustained damage to retinal ganglion cells (RGCs) (Büchi,1992;Resta et al.,2007;Vidal-Sanz et al.,2012;Fry et al.,2018;Chen et al.,2022).Previous research has shown that the shape and function of glial cells and neuroretinal cells undergo alterations when exposed to HOP (Almasieh et al.,2012;Tan et al.,2022).However,specific changes in the molecular landscape of these retinal cells remains to be further studied.
Multiple cell types work together to maintain retinal homeostasis.In pathological conditions such as injury,druginduced damage,and degeneration,the balance of the microenvironment is disturbed (Murakami et al.,2020;Yang et al.,2020).Previous studies have shown microglia activation and vascular changes in many retinal diseases (Silverman and Wong,2018;Zhang et al.,2018;Rathnasamy et al.,2019;Liu et al.,2022;Zhang et al.,2022).Nevertheless,in order to create novel therapies,it is imperative to investigate the landscape of the retina under HOP.Single-cell RNA sequencing (scRNAseq) is powerful in simultaneously studying the molecular characteristics of complex tissues at the single-cell level (Voigt et al.,2021;Wang et al.,2023).The application of scRNΑseq has broadened our understanding of the composition and developmental regulation of retinal cells (Hu et al.,2019;Menon et al.,2019;Cowan et al.,2020;Lu et al.,2020;Sridhar et al.,2020;Van Hove et al.,2020;Wang et al.,2021;Wu et al.,2021;Finkbeiner et al.,2022),including subtypes of RGCs and aqueous humor outflow tissue (Langer et al.,2018;Teotia et al.,2020;van Zyl et al.,2020).However,scRNA-seq has not previously been used to investigate the characteristics of retinal cells under HOP.In this study,we used scRNA-seq to explore the molecular characteristics of the retina under HOP,revealing dynamic cell-cell communication in this condition.
Methods
Animals
This study was performed in accordance with the Αssociation for Research in Vision and Ophthalmology (ARVO) Statement(Association for Research in Vision and Ophthalmology,2021) and was approved by the Institutional Αnimal Care and Use Committee of the General Hospital of Chinese People’s Liberation Αrmy (approval No.KY2022-003).Α total of 28 male 4-week-old Sprague-Dawley rats (weighing 110–120 g) were acquired from the Experimental Animal Center of the Chinese PLA General Hospital (Beijing,China;license No.SCXK [Jing]2021-0006).All rats were housed under specific pathogenfree conditions in a temperature-controlled environment (21 ±1°C) with a 12-hour light/dark cycle and humidity of 40–50%.They had unrestricted access to food and water,and those with eye diseases were excluded (four rats in total).Overall,24 animals were randomly assigned into a control group and HOP group,with 12 in each group (six for scRNA-seq;and six for hematoxylin and eosin (HE),hematoxylin and eosin staining,immunofluorescence staining,and terminal dUTP nick end labeling [TUNEL] staining).Only male mice were used in our study for the reason that previous study has indicated that estrogen has a neuroprotective effect (Petrovska et al.,2012).
HOP model
The rat acute HOP model was reproduced following previous research (Liu et al.,2020).Rats were anesthetized by inhalation of isoflurane (R500IE;RWD,Shenzhen,China)mixed with pure oxygen with a ratio of 1:1.Induction anesthesia used a concentration of 2–3% and when the rats entered a state of anesthesia maintenance,the concentration was changed to 2% for 4–5 minutes.Next,1% oxybuprocaine hydrochloride eye drops (Shimoshinjo 3-chome;Higashiyodogawa-ku,Osaka,Japan) were administered to the rat’s ocular surface,then a sterile 32G needle was used to penetrate the cornea (running parallel to the iris along the limbus).Α 3 µL volume of cross-linked hyaluronic acid hydrogel(Healaflow®;Anteis SA,Lonay,Switzerland) was introduced into the front chamber of the eye to trigger HOP.Αntibiotics were used before and post-operation to avoid infection.Using the same procedure,the control group received an injection of normal saline of equal volume.Αll injections were performed in the right eye.Intraocular pressure (IOP) was recorded using a rebound tonometer (TA-01;Icare Finland Oy,Vantaa,Finland),1 day before the operation,and 0,1,and 7 days after injection,in the morning.The mean value of three consecutive IOP readings was calculated.Rats were euthanized by overdose of CO2inhalation.Specifically,CO2was injected into the euthanasia box at a rate of 30% to 70%of volume per minute for 35 minutes.The rats were sacrificed at 7 days post-operation,and the eyeballs of injected eyes were collected for scRNA-seq,hematoxylin and eosin staining,immunofluorescence staining,and TUNEL staining (Liu et al.,2020;Additional file 1).
scRNA-seq of rat retina and optic nerve
Single cells from retinal tissues (including the choroid and optic nerve) were collected on the 7thday after inducing HOP,and captured using the 10× Chromium system (V3;10× Genomics,San Francisco,CΑ,USΑ) according to the manufacturer’s protocol.Single-cell libraries were loaded into the Illumina Nova 6000 system (Illumina,San Diego,CA,USA)for sequencing.
Bioinformatics processing
Using the 10 Genomics Cellranger software (Version 3.1,10×Genomics) pipeline process,the matrices of two samples were obtained and loaded into the Seurat R package (Hao et al.,2021),with low quality cells filtered out.Α total of 3000 genes were selected from each sample.After correcting for batch effects,the data were combined into one dataset via canonical correlation analysis implemented in Seurat(Hao et al.,2021).After scaling the data,linear dimension reduction was performed by principal component analysis,and a neighborhood graph computed using Louvain clustering(resolution 0.6).This was then embedded in two-dimensional space using the nonlinear dimensional reduction method of uniform manifold approximation and projection (Becht et al.,2018).The mean gene expression of all identified genes and top-100 genes with differential expression were obtained for every cluster.A gene that exhibited differential expression was characterized as showing significant expression (P<0.05 after adjusting for multiple comparisons) in at least 25% of cell populations,displaying an average difference of >0.25-fold (log-scale) between groups of cells.Gene Ontology (GO)analysis of the indicated genes was performed using the cluster Profiler package (Yu et al.,2012).The GO categories encompass biological processes,cellular components,and molecular functions.Significantly enriched terms were those with aP-value <0.05.
Pseudotime analysis
The Monocle 2 R package (https://bioconductor.org/packages/release/bioc/html/monocle.html) was used to perform pseudotime analysis (Cao et al.,2019).The orderCells function was used to arrange and display the cells along the quasichronological path.
Intercellular interaction network analysis
Cell-cell communication was computed via ligand-receptor interactions.The cell-cell communication network was constructed and visualized using CellChat software (http://www.cellchat.org/) (Jin et al.,2021).
Statistical analysis
IOP values were represented as mean ± standard deviation(SD).Data from the two groups underwent statistical analysis using two-tailed unpaired Student’st-tests,assuming equal variance.GraphPad Prism 9.5.0 (GraphPad Software,San Diego,CΑ,USΑ,www.graphpad.com) was used for statistical analyses,withP<0.05 considered statistically significant.
Results
scRNA-seq of retinas with HOP
The flowchart of our entire experiment is shown inFigure 1A.The rat acute HOP model was successfully established and changes in IOP of the operated eyes are shown inFigure 1B;these are similar to a previous study (Liu et al.,2020).We measured baseline IOP before the operation.The IOP of the experimental eyes was 9.32 ± 0.76 mmHg and that of the control eyes was 9.16 ± 0.81 mmHg,with no statistically significant difference (n=12,P>0.05).Αfter Healaflow®injection,the IOP increased to 48.46 ± 3.22 mmHg.On days 1 and 7,IOP declined to 40.58 ± 4.06 mm Hg and 35.58 ± 2.90 mm Hg,which are higher than in the control group (n=12,P<0.001;Figure 1B).As shown in our previous study (Liu et al.,2020),the ganglion cell layer can undergo a sequence of apoptosis-like changes at 7 days after HOP injury (Additional file 1andAdditional Figure 1A).Therefore,we wanted to determine the precise molecular characteristics of retinal cells at 7 days after HOP.We performed scRNA-seq experiments with retina and optic nerve tissues derived from control and HOP rats (Figure 1C).Αfter excluding low quality cells,a total of 21,464 cells (Control: 10,586,HOP: 10,878) were obtained.The average number of genes in each cell was 1279,and the total number of genes reached 16,729.Cells were classified into 18 clusters after integration,dimension reduction,and clustering.Based on specific marker genes,we assigned these cells to 12 cell types (Figure 1C).As shown by uniform manifold approximation and projection (UMΑP),the cell types are retinal pigment epithelial cells (marked byTyr2),rodphotoreceptor cells (marked byRHO),bipolar cells (marked byVsx2),Müller cells (marked byRlbp1),microglia (marked byCx3cr1),cone-photoreceptor cells (marked byGnat2),RGCs(marked byStmn2),endothelial cells (marked byVwf),pericyte cells (marked byRgs5),fibroblast cells (marked byLum),retinal progenitor cells (marked bySox2),and oligodendrocyte cells (marked byOligo2) (Figure 1D).
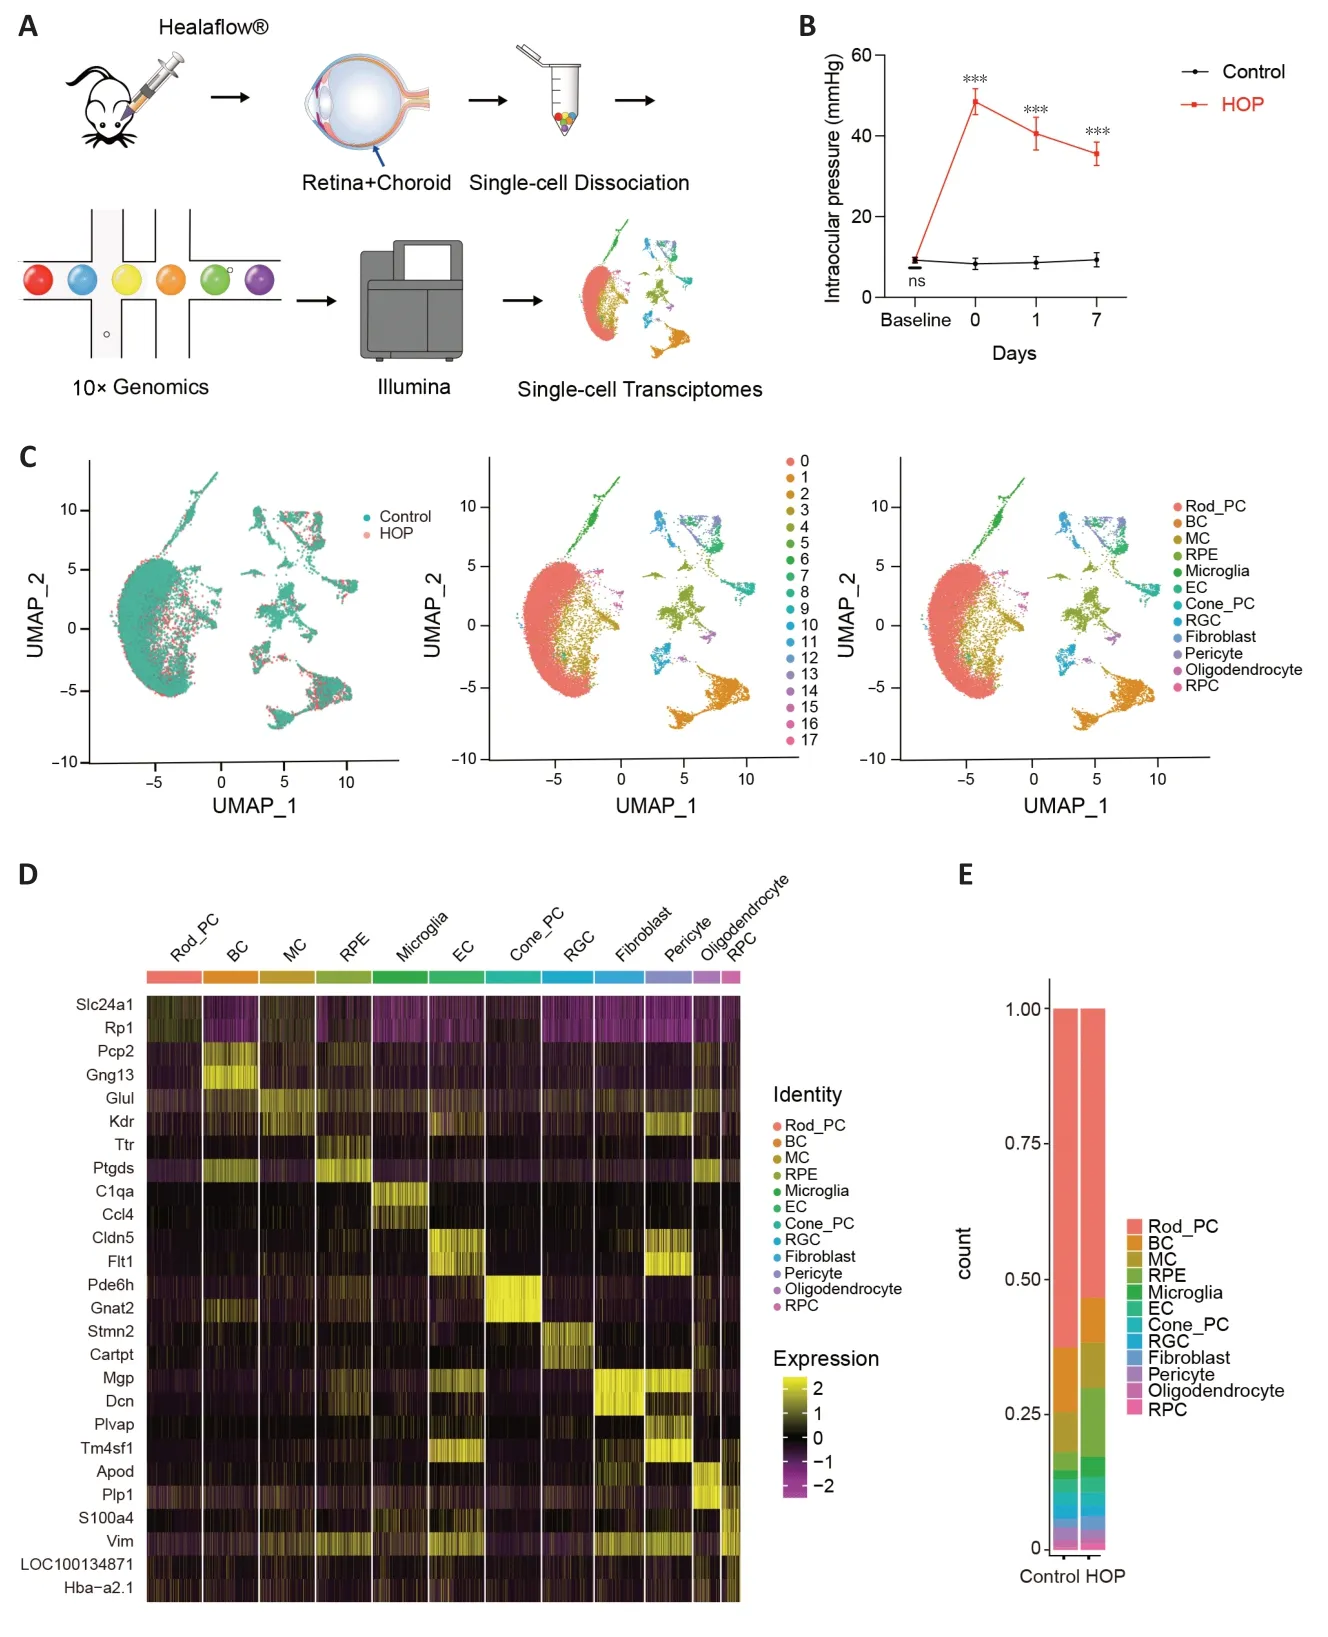
Figure 1|Identification of rat retinal cells using singlecell RNA sequencing.
Cell ratio analysis of retinal cells showed a decrease in photoreceptor,bipolar,and RGCs,with increases in microglia observed (Figure 1EandAdditional Table 1).These results indicate that HOP induced profound injury of retinal cells.
Analysis of the gene expression pattern of RGCs related to HOP
As RGCs are the cell type most susceptible to HOP,terminal deoxynucleotidyl transferase dUTP nick end labeling (TUNEL)staining was further performed to detect apoptosis in the HOP group (Additional file 1).Under HOP,there was a rise in TUNEL+cells within the ganglion cell layer (Additional Figure 1BandC).We next sought to clarify the post-injury gene expression profile.After comparing different genes in RGCs between the control and HOP groups (Figure 2A),dot plots showed that theZwint,Calb2,Dkk3,Catpt,Rtn1,andTmsb4xgenes were significantly upregulated,while theSlc24a1,Cers4,Plp1,Cst3,Spp1,Zc3h13,Synpr,Gabra1,Hpca,Stmn1,Cplx2,andZmiz1genes were downregulated(P<0.05;Figure 2B).GO analysis showed activation of signaling pathways involved in organic hydroxy compound transport and regulation of organic acid binding (Figure 2C).Next,we characterized RGCs subpopulations based on cellular heterogeneity.We reclustered the RGCs and obtained four clusters (Figure 2D).Of these,RGCs cluster 3 showed the most distinct expression profile and a decreased ratio after HOP (Figure 2EandF).Therefore,we further analyzed cluster 3.Interestingly,we discovered that a cluster of genes related to the cellular division process (likeZwint),exhibited increased expression (P<0.05).Αctivation of theB3gat2gene,which plays a role in producing the human natural killer-1 (HNK-1) carbohydrate epitope was observed;this is a sulfated trisaccharide associated with cellular migration and adhesion in the nervous system (Kähler et al.,2011;P<0.05).ThePpp1r1agene,which plays a role in inhibiting protein phosphatase and serine/threonine phosphatase activities (Luo et al.,2018),was also found to be upregulated(P<0.05).Interestingly,downregulation ofGabra1andPtprdwas involved in regulating the neuronal signal transduction pathway (Wang et al.,2017;Uhl et al.,2018;P<0.05).In addition,theTsc22d3gene,which is involved in inhibiting proinflammatory molecules (Sevilla et al.,2015),was significantly downregulated (P<0.05).These results strongly indicate that HOP caused damage to cluster 3 RGCs and may initiate a strong inflammatory response (Figure 2G).Monocle pseudotime analysis showed cell state transmission of cluster 3 after HOP injury (Figure 2H–J).
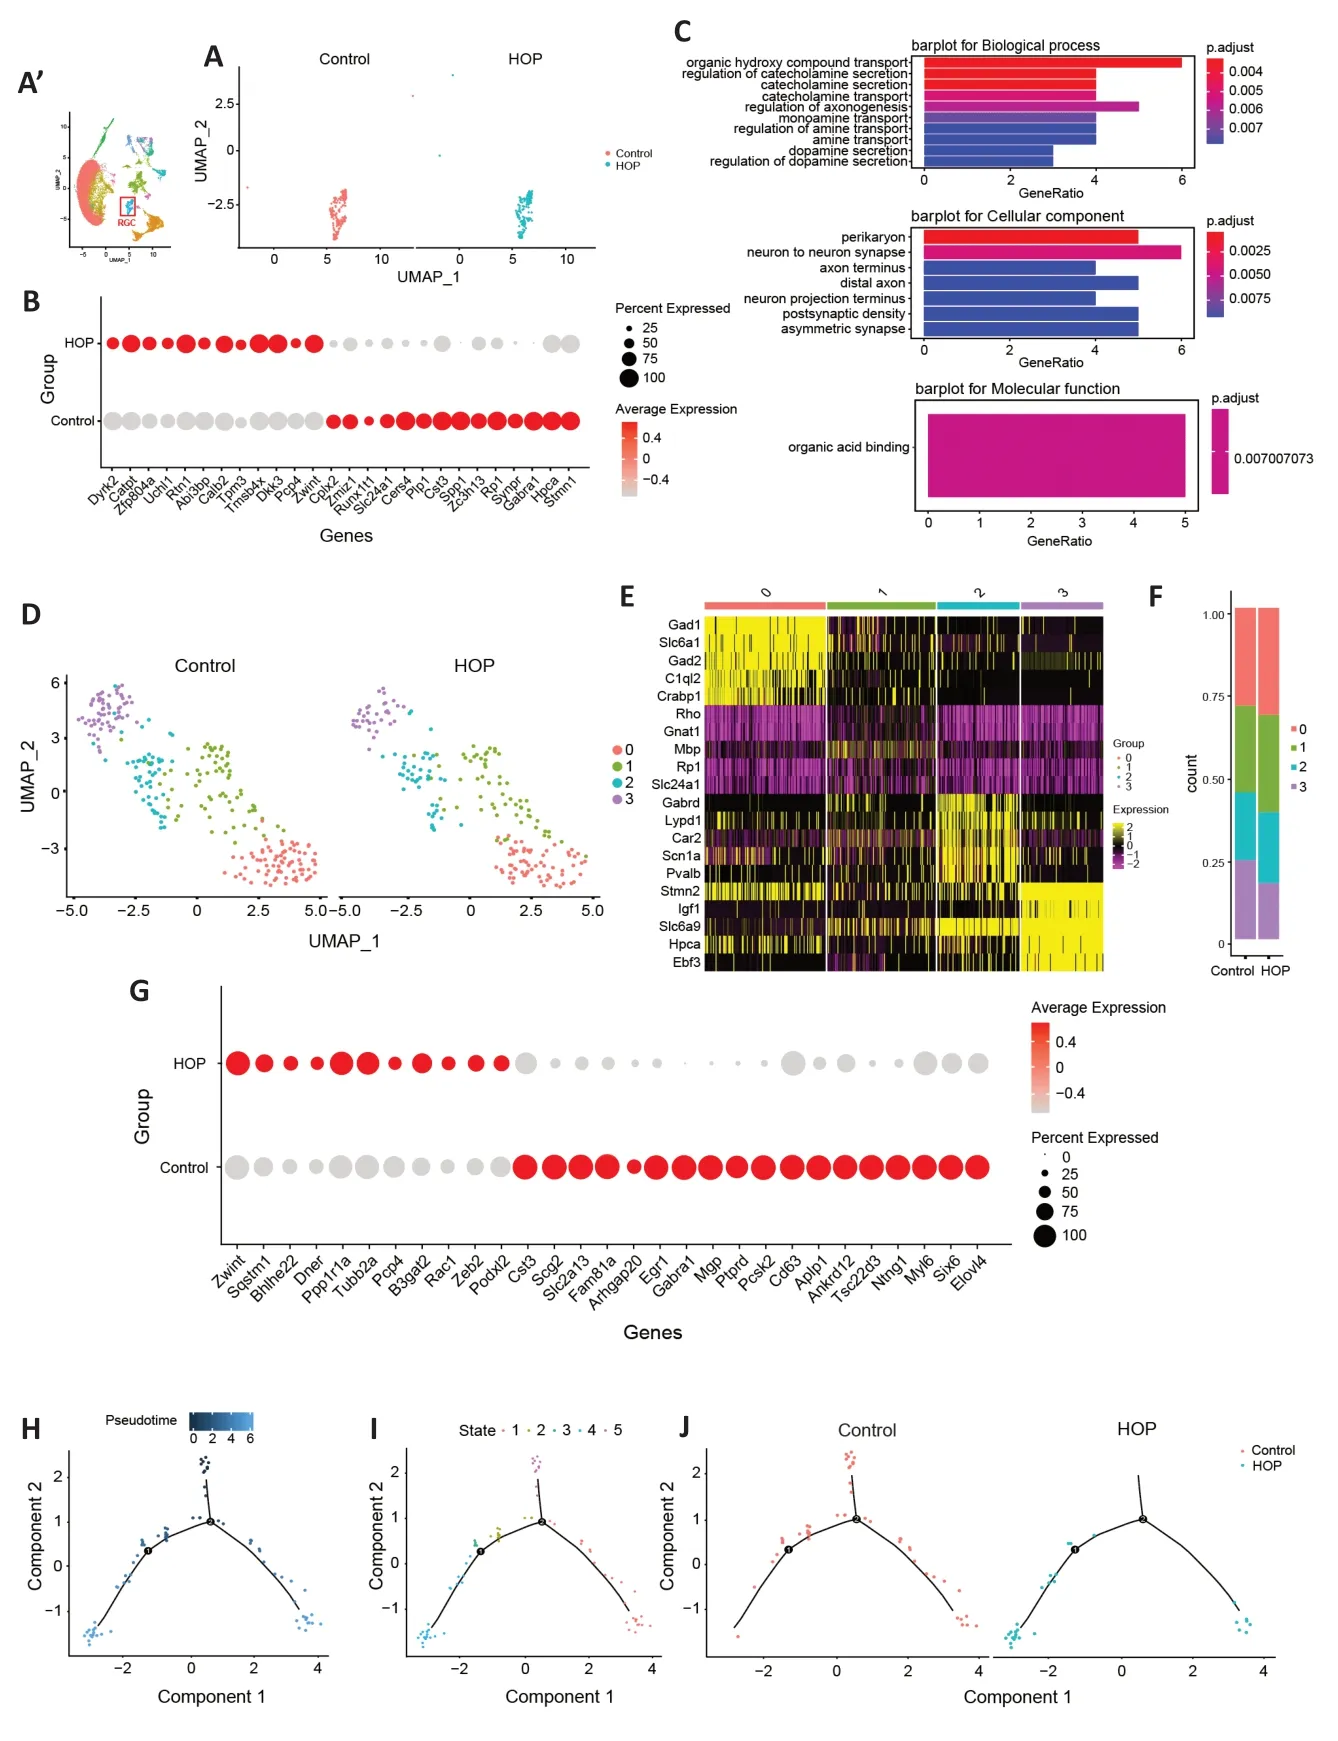
Figure 2|Characterization of gene expression profiles of RGCs after high intraocular pressure injury.
Dissecting microglia gene expression profiles and heterogeneity induced after HOP
Prior research has shown a significant function of microglia in upholding retinal balance and the pathological state (Silverman and Wong,2018).Immunofluorescence staining showed an increase in ionized calcium binding adaptor molecule 1(Iba1)-positive cells under HOP (P<0.001;Additional file 1andAdditional Figure 2A–D).Moreover,our scRNA-seq data revealed an increase in the microglia ratio after HOP.These findings may indicate activation of microglia after HOP injury.We proceeded to investigate alterations in the microglia gene expression profile after HOP,and observed significant changes in the expression of numerous genes associated with this mechanism (Figure 3A).Compared with the control group,Fcer1gwas significantly increased and expressed at a high level in the HOP group.We also demonstrated this by immunofluorescence staining (P<0.05;Figure 3B,Additional file 1andAdditional Figure 2E–G).GO analysis revealed activation of several signaling pathways (Figure 3C).For instance,Ccl11,Gpnmb,C3,Il1b,Ctsh,Ccl6,Gnai2,Ccl4,andAtf3have been implicated in extracellular signal-regulated kinase (ERK1/2) cascade activation (Li et al.,2015;Wan et al.,2022;Wang et al.,2022);Tspo,Il1b,andVimare involved in regulating glial cell proliferation and gliogenesis (Fu et al.,2020;Xie et al.,2020;Aswendt et al.,2022);Gpnmb,Tspo,Ccl4,Tyrobp,Pik3r1,andCcr5have been identified in the regulation of tumor necrosis factor production (Tomihari et al.,2009;Sindhu et al.,2019;Nosalski et al.,2020;Barca et al.,2021;Ng et al.,2021);Ccl11,Spp1,Il1b,Ccl6,Ccl4,Ccr5,andEdn3are involved in granulocyte,leukocyte,and other cell chemotaxis processes (Poole et al.,2013;Sugaya,2015;Zhou et al.,2020);andLyz2plays important roles in enabling lysozyme activity (Orthgiess et al.,2016).These data indicate not only that microglia are activated but also that they might initiate a series of downstream inflammatory reactions during periods of HOP.
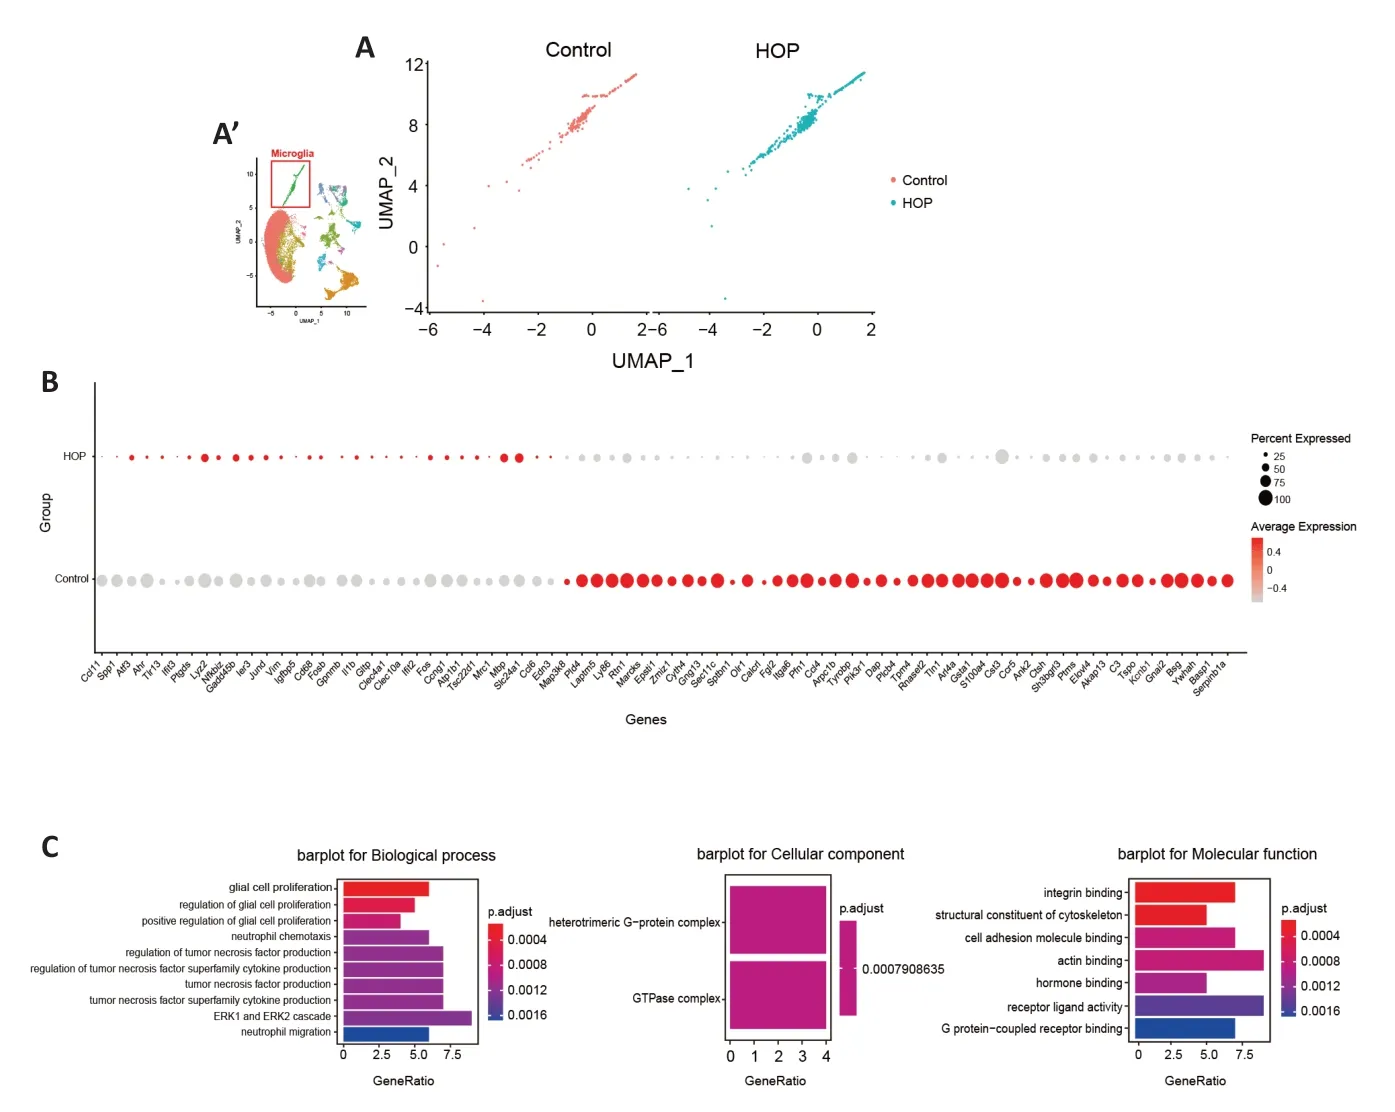
Figure 3|Molecular characteristics of microglia after high intraocular pressure injury.
Characteristic changes in endothelial and pericyte molecular markers induced by HOP
Vascular maintenance requires the participation of retinal pericytes and endothelial cells (Choi et al.,2018).Earlier research has shown pericyte and endothelial cell dysfunction in conditions like retinopathy of prematurity,retinal vein occlusion,and diabetic retinopathy (Hughes et al.,2006;Huang,2020).We aimed to explore the molecular characteristics of these cells after HOP.Αlterations in pericyte gene expression were found (Figure 4A).TheAqp1,Igfbp3,Ccl2,andS100a4genes were upregulated in pericyte cells,while theTagln,Icam1,Ccl19,Tpm1,Btg2,andEgr1genes were downregulated (P<0.05;Figure 4B).Moreover,Monocle pseudotime analysis illustrated gene expression module changes after HOP (Figure 4C).GO analysis revealed that pathways involved in the regulation of cell projection assembly,chemokine activity,and CC chemokine receptor(CCR) binding were significantly activated (Figure 4D).After comparing the different genes in endothelial cells between the control and HOP groups (Figure 5A),we found that theSlc39a10,Apoe,andloc100134871genes were downregulated.In contrast,theCrip1,Tpm2,Lgals1,Postn,Col3a1,Col1a1,Myh11,Tagln,Des,Igfbp5,andActa2genes were strongly upregulated (P<0.05;Figure 5B).Monocle pseudotime analysis further demonstrated gene expression module changes after HOP (Figure 5C).GO analysis revealed that the extracellular structure organization pathway,negative regulation of cell-substrate adhesion pathway,and extracellular matrix structural constituent pathway were activated (Figure 5D).These data indicate that HOP exerted a significant impact on the function of pericytes and endothelial cells.
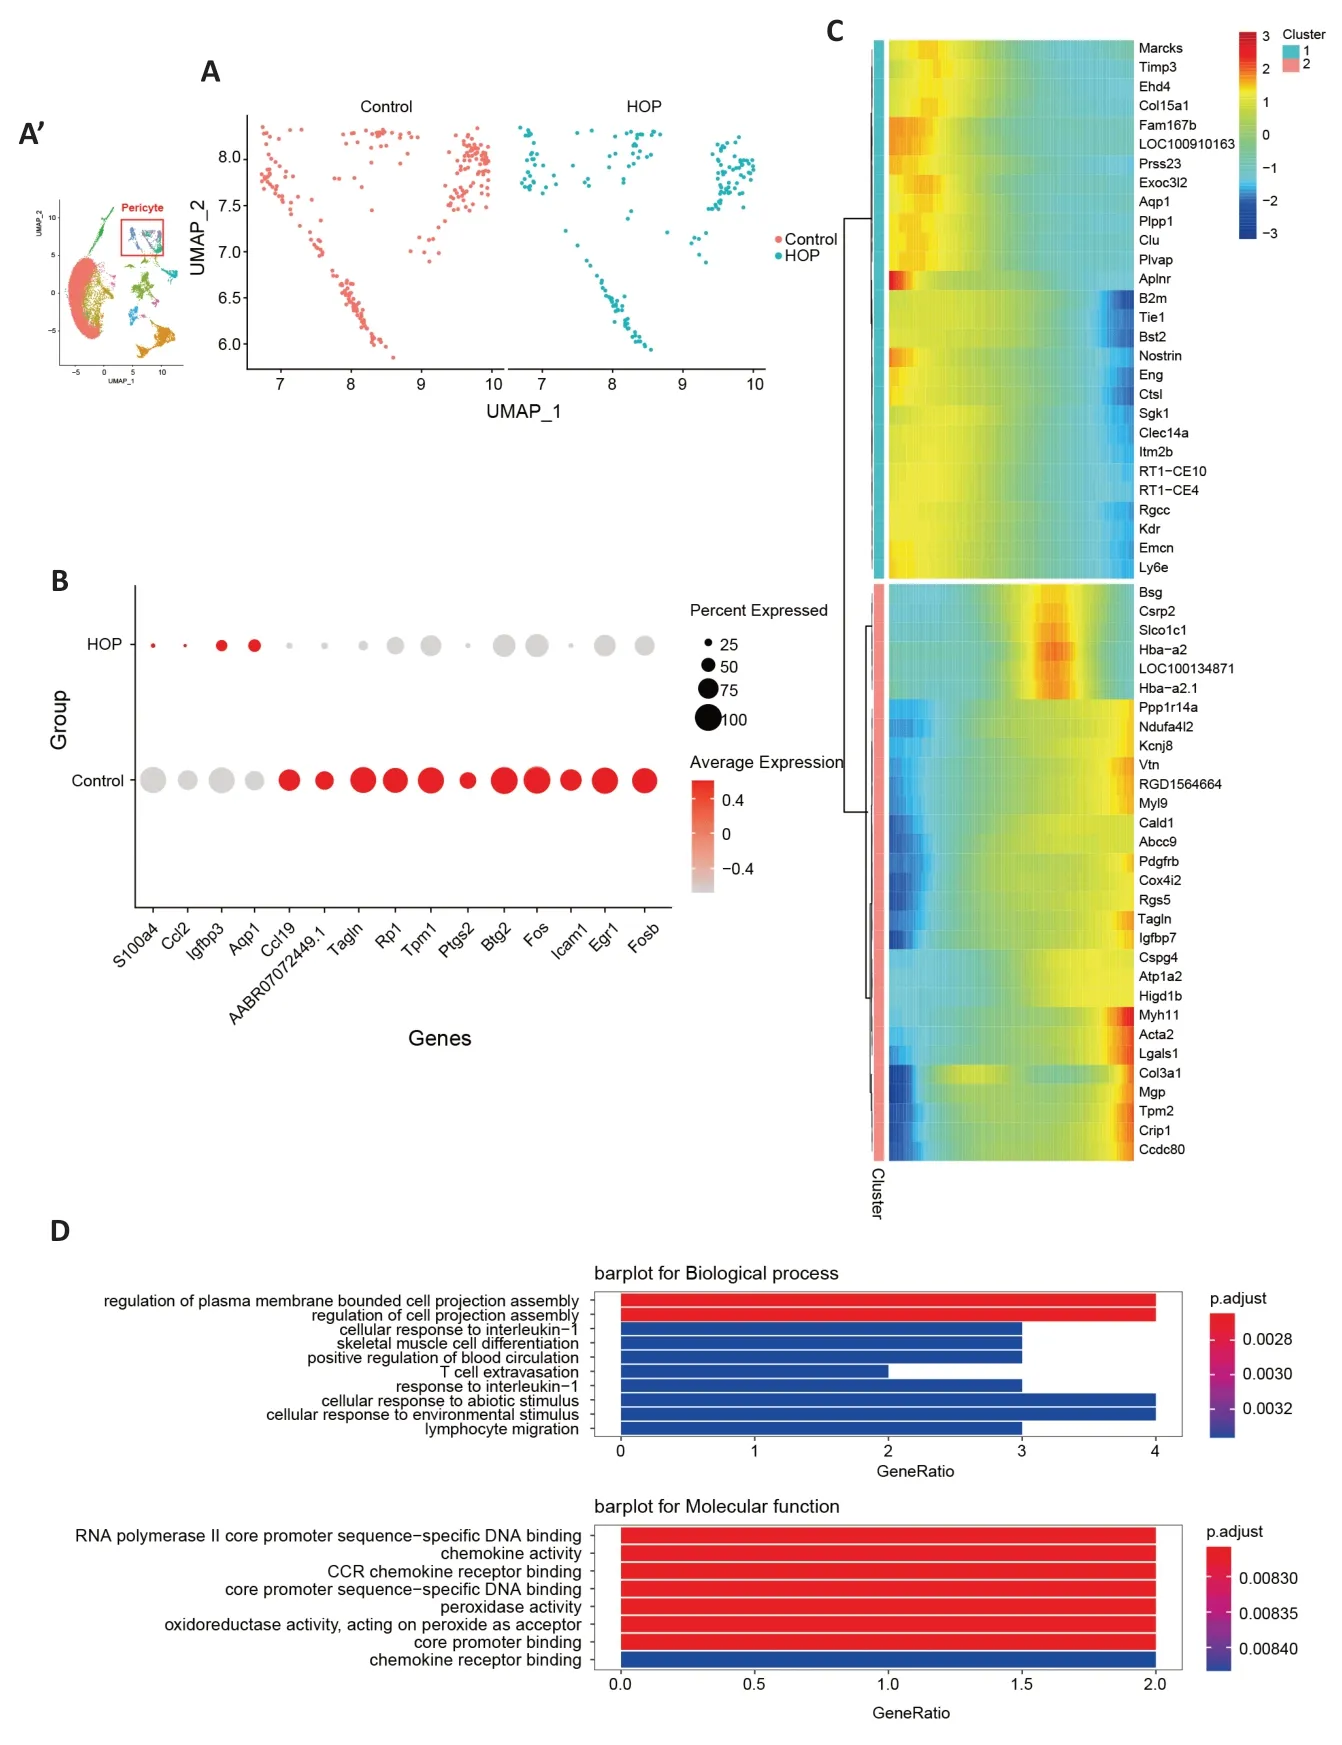
Figure 4|Molecular characteristics of pericyte cells after high intraocular pressure injury.
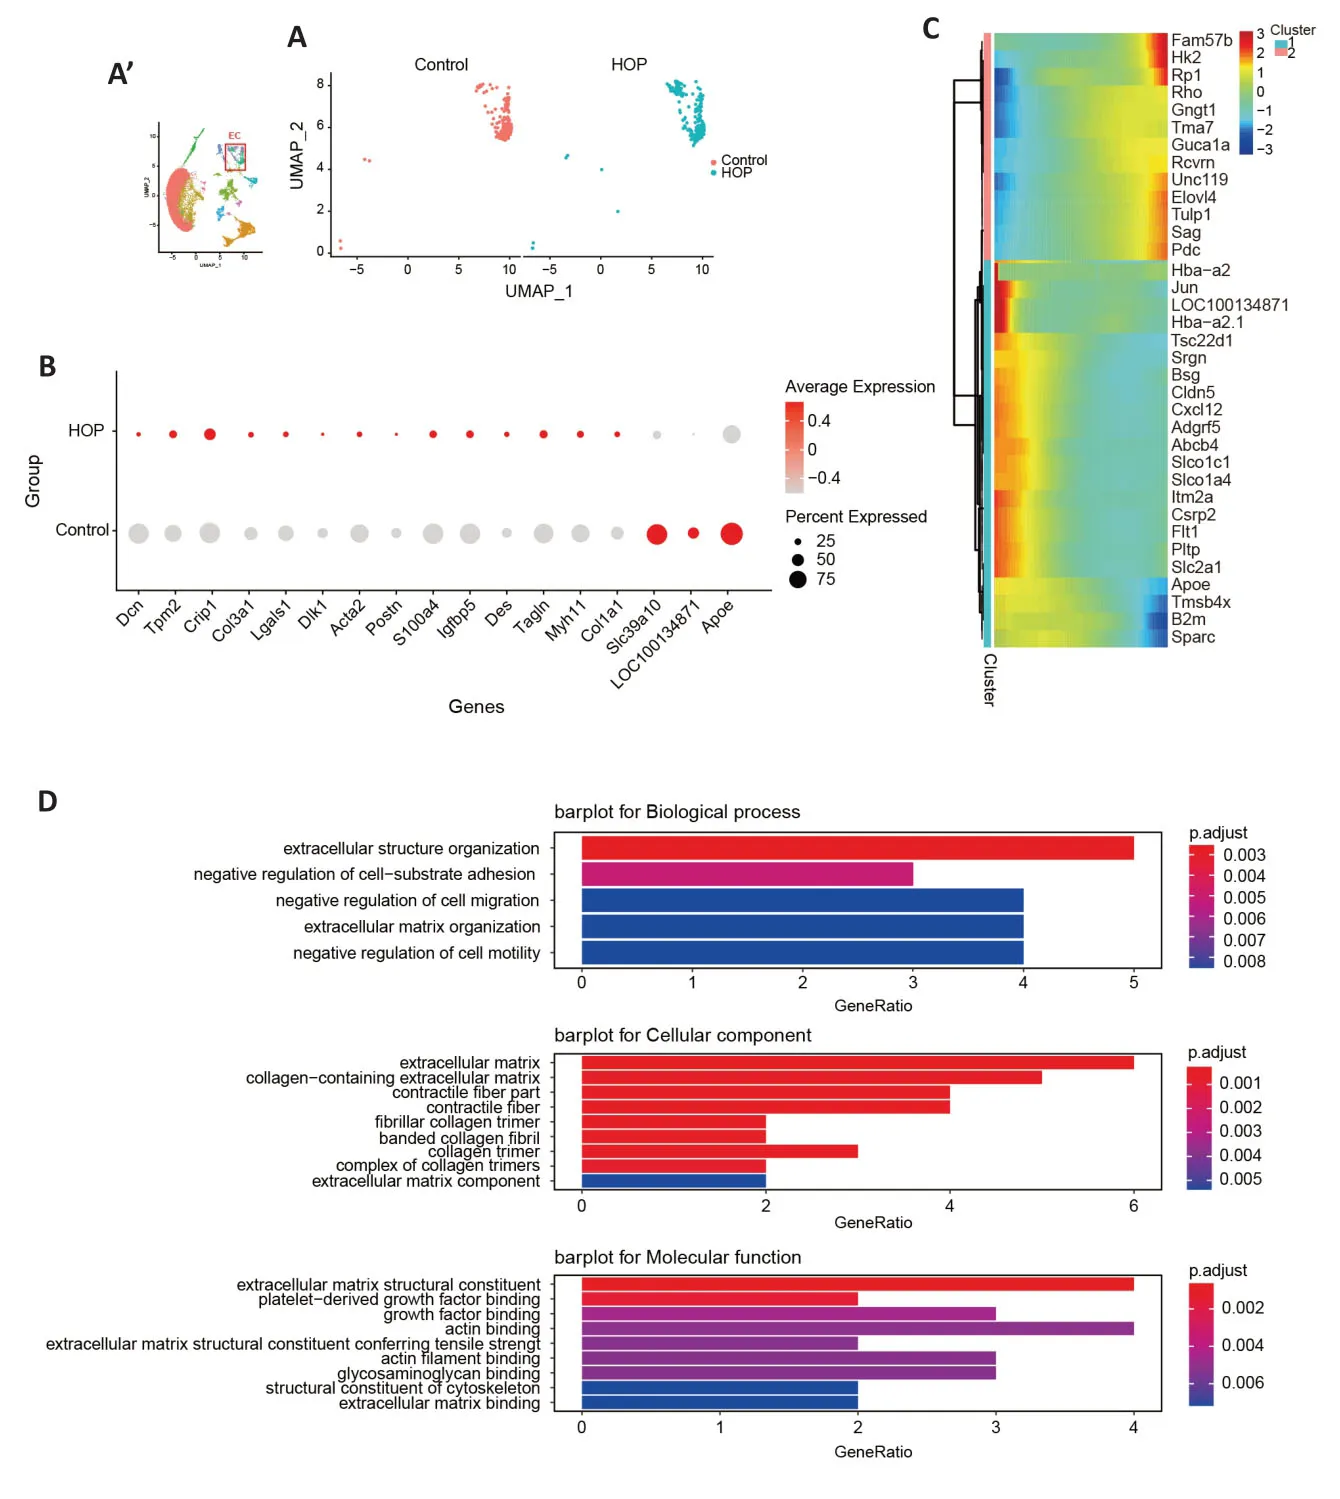
Figure 5|Molecular characteristics of endothelial cells after high intraocular pressure injury.
Intercellular interactions in the retina after HOP
The retina consists of numerous types of cells which interact with one another to ensure homeostasis.Therefore,we used CellChat to interpret complex intercellular communication networks after HOP injury (Figure 6A).The number of inferred interactions dropped from 665 to 619,corresponding to HOP,and the interaction strength dropped from 13.412 to 10.29 in all retinal cell types (Figure 6B).Next,we extracted RGCs and microglia to analyze putative interactions (Figure 6C).Among the two cell groups,CellChat detected three significant ligand-receptor pairs,further categorized into four signaling pathways (Sema3a,Igf1r,Egfr,andGas).Furthermore,we found that signaling ofEgfandGasfrom RGCs to microglia increased after HOP injury.In contrast,IgfandSema3apathway strength was decreased in RGCs-microglia and RGCs-RGCs (Figure 6D).Pericyte,microglia,and endothelial cell interactions were further demonstrated under HOP (Figure 6E).We extracted these three clusters,and CellChat analysis data revealed that the number of interactions increased from 32 to 34 while the interaction strength decreased from 0.465 to 0.124 in these three cell types.The detected ligandreceptor pairs were assigned to theTgfβ,Sema3a,Ptn,Pros1,Pdgf,Mdk,Csf,Egf,andCxcl12pathways.We found that after HOP injury,pericyte cells and microglia interacted more via thePros1,Pdgf,Egf,andGaspathways.Among these pathways,pericyte cells also interacted with endothelial cells through thePdgfandEgfpathways.We also observed thatTgfβ,Ptn,andMdkpathway activity was downregulated after injury (Figure 6F).

Figure 6|Identification of cellular interactions in the retina after injury.
Discussion
A variety of diseases and treatment measures increase IOP,which if sustained will lead to retinal injury.However,the specific molecular mechanisms underpinning this outcome need further exploration.Using scRNA-sequencing,we generated a cell atlas of the retina in rats with HOP in this study.We identified 12 cell types based upon distinct marker genes.In addition,we examined alterations in the gene expression profiles of RGCs,microglia,pericytes,and endothelial cells between control and HOP groups.Ultimately,we have demonstrated the effect of HOP on cellular communication and molecular characteristics of retinal cells at the individual cell level.
RGCs transmit visual signals to the brain and RGC injury leads to irreversible vision loss.There is a growing demand to identify the precise molecular mechanisms of RGCs in pathological conditions (Williams et al.,2020).Many studies have investigated the mechanisms of RGC injury in pathological conditions.JUN and DNA damage inducible transcript 3 (DDIT3;also known as C/EBP homologous protein[CHOP],an important factor in the endoplasmic reticulum stress response) work together to regulate RGC death when the optic nerve is injured (Syc-Mazurek et al.,2017).According to a previous investigation,activation of mitogenactivated protein kinase (MAPK) signaling caused by injury results in local energy deficiencies that ultimately lead to the death of RGCs (Yang et al.,2015).Reactivation of calciumcalmodulin (CaM)-dependent protein kinase II (CaMKII)protects RGCs from HOP (Guo et al.,2021).Tian and his team utilized advanced sequencing techniques to identify molecular targets for regeneration of the optic nerve in a model of optic nerve crush (Kole et al.,2020;Li et al.,2022;Tian et al.,2022).During our investigation,we examined the gene expression patterns of RGCs by scRNA-seq.Our findings revealed significant alterations in RGCs throughout HOP,which involved activation of organic acid binding regulation.In addition,we also observed metabolic changes in RGCs and this information may facilitate the identification of key genes that protect RGCs from injury in future work.
There is controversy over whether HOP-induced glaucoma leads to loss of retinal cells other than RGCs (Panda and Jonas,1992;Kendell et al.,1995;Wygnanski et al.,1995).However,several studies have confirmed that besides the ganglion cell layer,the morphology and function of the outer retinal layer is also damaged (Holopigian et al.,1990;Drasdo et al.,2001;Lei et al.,2008;Kanis et al.,2010;Choi et al.,2011;Werner et al.,2011).Our current investigation revealed a reduction in the number of photoreceptor cells in the HOP group,observed by analysis of retinal cell ratios.Αdditionally,TUNEL-stained cells were also detected in the outer retinal layer.Since the nucleus of photoreceptors is located in the outer nuclear layer,the loss of photoreceptors can be preliminarily confirmed in our HOP rat model.In a previous study in rodent models of laserinduced HOP,photoreceptor cell loss appeared independent and was a chronic degenerative process.Moreover,substantial degeneration of photoreceptors may occur after 6 months of HOP induction (Ortín-Martínez et al.,2015;Vidal-Sanz et al.,2015).Since we only examined retinal damage after 7 days of HOP,the specific mechanisms and processes of photoreceptor cell damage requires further research.
Sustained activation of the immune system can affect the progression of glaucoma (Xuejiao and Junwei,2022).In the retina,microglia are the primary cells of the innate immune system (Fan et al.,2022).The survival and regeneration of RGCs in optic nerve crush are significantly influenced by microglia and neuroinflammation (Au and Ma,2022).Our results confirmed the activation of microglia when IOP increased at the single-cell level,a finding that was strongly related to RGC degeneration.Minocycline diminishes microglia activation,leading to a decrease in the inflammatory reaction and cell death in a retinal degeneration model involving S100B(Grotegut et al.,2020).Conversely,other research found that phagocytosis of axon debris by activated microglia is important for axonal regeneration (Rathnasamy et al.,2019).These seemingly paradoxical results suggest functional diversity and heterogeneity of microglial populations.In pathological conditions,the use of single-cell transcriptomic sequencing data is highly beneficial for identifying alterations in gene expression profiles of particular microglia subgroups.The current study discovered a rise in the microglial population and significant alterations in the gene expression profiles of microglia.The GO analysis showed significant activation of signaling pathways related to glial cell proliferation,migration,and inflammatory factor release.These findings will enhance our understanding of microglial physiology.We will analyze the roles of these particular genes in the future,specifically in the development of glaucoma in retinal microglia.
In clinical work,patients suffering from HOP show massive anterior chamber effusion and retinal choroidal edema,which indicates blood-retinal barrier (BRB) disruption.A previous study has shown that astrocyte hyperreactivity in glaucomatous retinas can affect the properties of the inner retinal vasculature,which provides inspiration for future research in this field (Wang et al.,2002).The BRB is composed of closely linked capillary endothelial cells that are enveloped by pericyte and glial cells.These cells interact with each other to maintain the stability of the retinal microenvironment(Huang,2020).Nonetheless,the involvement of pericytes and endothelial cells in BRB control during HOP remains unexplored.A previous study demonstrated the crucial role of pericytes in the BRB,and was related to platelet-derived growth factor (PDGF)-B/PDGF receptor beta (PDGFRβ)signaling (Park et al.,2017).Studies found that the stromal cell-derived factor-1α (SDF-1)/C-X-C chemokine receptor type 4 (CXCR4) signaling pathway is crucial in the breakdown of the BRB,along with inflammation.In this study,we found that control of the cell-substrate attachment signal was reduced,leading to increased sensitivity of pericytes and endothelial cells to chemokines (Ogura et al.,2017;Omori et al.,2018).Using CellChat,we first identified active interactions in pericyte-microglia and pericyte-endothelial cell pairs;however,a weak interaction intensity between microglia and endothelial cells was detected.We further found that activity of the PDGF,PTN,and GAS pathways was significantly increased in these three cell types after HOP injury.We found that the Gas6-Αlx pathway was significantly increased in microglia-pericytes.Recently,disease-associated microglia were found in the central nervous system.Axl,as TAM receptors associated with the immune response,are upregulated in disease-associated microglia of an Alzheimer’s disease model compared with a control group.This suggests that Axl may participate in the process of microglia related-neurodegeneration (Keren-Shaul et al.,2017).Therefore,our data strongly indicate that in the treatment of glaucoma patients,we should not only control IOP,but also develop new measures such as inhibiting aseptic inflammation and protecting fragile neurons.
Actually,our study has several limitations.First,although we can observe glaucomatous changes in rat eyes,the principal disadvantage is that beads or Healaflow® can be difficult to retain after injection,resulting in a variable increase in IOP.This kind of model is difficult to simulate chronic glaucoma.Second,we found changes of retinal cell gene expression under HOP,but RNAscope is certainly needed in future work.Unfortunately,due to the low cell number,we could not identify amacrine cell or horizontal cell clusters in our dataset.Finally,we specifically analyzed molecular changes in the rat retina under HOP,while differences in cell types and gene expression between species were evident.Additional data on scRNA-seq of the human retina in glaucoma is still required.In the future,we will continue to conduct comprehensivein vivoandin vitrostudies to verify the data obtained in this present study.
To summarize,we have developed a transcriptomic atlas of the retina following HOP by focusing on individual cells.The comprehensive identification of gene expression characteristics of every individual cell in the retina and optic nerve was achieved following HOP at the cellular level.Αdditionally,we examined the interaction between microglia,pericytes,and endothelial cells and maintenance of the BRB integrity under normal and HOP conditions.Our data serve as a foundation for furthering our understanding of the molecular mechanisms that cause glaucoma damage and for identifying novel target signaling pathways for intervention.
Author contributions:Conceptualization:DW,SW,YL;methodology:DW,SW,XJ,YL;validation:DW,SW,ST,NL,YL;formal analysis:DW,SW,ST,YS;investigation:DW,SW;resources:DW,PD;data curation:DW,SW,ST,YL;writing-original draft preparation:DW,SW,ST.All authors have read and agreed to the published version of the manuscript.
Conflicts of interest:The authors declare no conflict of interest.
Data availability statement:This article and its Additional files contain all the data produced or examined during this study.The unprocessed sequence information presented in this article has been stored in the Genome Sequence Archive(Genomics,Proteomics &Bioinformatics 2021)at the National Genomics Data Center,China National Center for Bioinformation/Beijing Institute of Genomics,Chinese Academy of Sciences(GSA:CRA010582),which is available to the public.
Open access statement:This is an open access journal,and articles are distributed under the terms of the Creative Commons AttributionNonCommercial-ShareAlike 4.0 License,which allows others to remix,tweak,and build upon the work non-commercially,as long as appropriate credit is given and the new creations are licensed under the identical terms.
Additional files:
Additional file 1:The materials and methods of the hematoxylin and eosin staining,immunofluorescence staining,and TUNEL staining.
Additional Figure 1:HE staining and TUNEL staining of the retinas.
Additional Figure 2:Immunofluorescence staining of the retinas and optic nerves.
Additional Table 1:The cell count of each cell type is shown by single-cell sequencing.
- 中国神经再生研究(英文版)的其它文章
- A sphingolipid message promotes neuronal health across generations
- Krüppel-like factor 2 (KLF2),a potential target for neuroregeneration
- Defined hydrogels for spinal cord organoids: challenges and potential applications
- Neuronal trafficking as a key to functional recovery in immunemediated neuropathies
- Advancements in personalized stem cell models for aging-related neurodegenerative disorders
- New insights into astrocyte diversity from the lens of transcriptional regulation and their implications for neurodegenerative disease treatments