
Lobe-dominated γ-Ray Emission of Compact Symmetric Objects
2024-03-22 04:11YingYingGanHaiMingZhangXingYangYingGuandJinZhang
Ying-Ying Gan, Hai-Ming Zhang, Xing Yang, Ying Gu, and Jin Zhang
1School of Physics, Beijing Institute of Technology, Beijing 100081, China; j.zhang@bit.edu.cn
2 School of Astronomy and Space Science, Nanjing University, Nanjing 210023, China
3 Guangxi Key Laboratory for Relativistic Astrophysics, School of Physical Science and Technology, Guangxi University, Nanning 530004, China
Abstract The γ-ray emitting compact symmetric objects(CSOs)PKS 1718–649,NGC 3894,and TXS 0128+554 are lobedominated in the radio emission.In order to investigate their γ-ray radiation properties, we analyze the ∼14 yr Fermi/LAT observation data of the three CSOs.They all show the low luminosity (1041–1043 erg s-1) and no significant variability in the γ-ray band.Their γ-ray average spectra can be well fitted by a power-law function.These properties of γ-rays are clearly different from the γ-ray emitting CSOs CTD 135 and PKS 1413+135, for which the γ-rays are produced by a restarted aligned jet.In the Lγ-Γγ plane,the three CSOs are also located at the region occupied by radio galaxies(RGs)while CTD 135 and PKS 1413+135 display a similar feature to blazars.Together with a similar radio emission property to γ-ray emitting RGs Cen A and Fornax A,we speculate that the γ-rays of the three CSOs stem from their extended mini-lobes.The broadband spectral energy distributions of the three CSOs can be well explained by the two-zone leptonic model,where their γ-rays are produced by the inverse Compton process of the relativistic electrons in extended regions.By extrapolating the observed Fermi/LAT spectra to the very high energy band,we find that TXS 0128+554 among the three CSOs may be detected by the Cherenkov Telescope Array in the future.
Key words: galaxies: active – galaxies: jets – radio continuum: galaxies – gamma-rays: galaxies
1.Introduction
Compact symmetric objects (CSOs), a sub-class of active galactic nuclei (AGNs), are distinguished by a symmetric and compact radio structure with the projection size≤1 kiloparsec (kpc).Their symmetric radio structure is thought to be due to a misaligned jet with no or weak relativistic effect(Phillips & Mutel 1980; Wilkinson et al.1994; Readhead et al.1996).Thus CSOs look like the mini-version of off-axially observed radio galaxies (RGs).However, some CSOs show obvious flux variation at the radio band, even significant variability and high luminosity in γ-ray band, indicating the strong Doppler boosting effect of a relativistic jet (Gan et al.2021, 2022).Recently, Kiehlmann et al.(2023) reported that in addition to the compact symmetric structure, no significant flux variation and superluminal motion should be taken as a criterion for the CSO selection, that is to say no relativistic effect.
It is well known that blazars are the main one of the extragalactic γ-ray emitters since a relativistic jet dominates their multi-band radiations, and their γ-rays are from an aligned pc/sub-pc jet.Generally,it is believed that the γ-rays of RGs are also generated from their pc/sub-pc jets(e.g.,Abramowski et al.2012; Aliu et al.2012; Grandi et al.2012; Casadio et al.2015;Tanaka et al.2015;Xue et al.2017).Nevertheless,the detections of γ-rays from the large-scale lobes of RGs Cen A and Fornax A by the Fermi/LAT indicate the existence of high-energy particles in these extended regions (Abdo et al.2010; Ackermann et al.2016).Until now, five CSOs have been detected in the γ-ray band,including PKS 1718–649(Migliori et al.2016),NGC 3894(Principe et al.2020),TXS 0128+554(Lister et al.2020), CTD 135(Gan et al.2021),and PKS 1413+135(Principe et al.2021;Gan et al.2022).The high luminosity and remarkable variability of CTD 135 and PKS 1413+135 observed by the Fermi/LAT,similar to blazars,demonstrate that their γ-rays are dominated by the radiation of a recently restarted aligned core-jet (Gan et al.2021, 2022).Theoretically, the mini-lobes of CSOs can also produce strong γ-ray emission via inverse-Compton (IC)processes (Stawarz et al.2008; Migliori et al.2014), or by thermal bremsstrahlung radiation (Kino et al.2007, 2009), even through the hadronic processes(Kino&Asano 2011),similar to the large-scale lobes of Cen A and Fornax A (Abdo et al.2010;McKinley et al.2015).
The core-dominance parameter, which is defined as the luminosity ratio(RCE)of the core to extended regions,RCE>1 for core-dominated and RCE<1 for lobe-dominated, is often used as an indicator of the beaming effect (e.g., Urry &Padovani 1995).We note that Cen A and Fornax A have low values of RCEat the radio band compared with other γ-ray emitting RGs.The RCEvalues at 8 GHz4The data are taken from the Radio Fundamental Catalog (RFC), http://astrogeo.org/rfc/.are 0.48, 0.36, and 0.71 for PKS 1718–649, NGC 3894, and TXS 0128+554,respectively.Especially for PKS 1718–649,even no clear radio core is resolved (Angioni et al.2019), resembling a miniversion of Fornax A (very weak radio core, McKinley et al.2015).Whereas, RCEis ∼1 for CTD 135 and 1.42 for PKS 1413+135.It seems to be coincident with that PKS 1413+135 and CTD 135 are reclassified as blazars rather than CSOs(Readhead et al.2021; Frey et al.2022).Different from CTD 135 and PKS 1413+135,PKS 1718–649,NGC 3894,and TXS 0128+554 definitely satisfy the CSO criteria asked by Kiehlmann et al.(2023).In this paper, we intend to explore the γ-ray radiation properties of the three lobe-dominated CSOs by completely analyzing their Fermi/LAT observation data.Throughout, H0=71 km s-1Mpc-1, Ωm=0.27, and ΩΛ=0.73 are adopted in this paper.
2.Lobe-dominated gamma-ray Emitting CSOs
PKS 1718–649, also named NGC 6328 and located in a compact gas environment with redshift of z=0.014 (Fosbury et al.1977).It is also classified as a GHz-peak spectrum(GPS)source due to a turnover frequency of ∼3 GHz at radio spectrum(Tingay et al.1997).Its morphology at multiple radio bands is characterized as two sub-structures from southeast to northwest (Tingay et al.1997, 2002), and the total projection size at 8.4 GHz and 22.3 GHz is only 2.5 pc (Angioni et al.2019).No clear radio core is resolved at multiwavelength observations.However, the spectral index map from 8.4 to 22.3 GHz (Figure 6 in Angioni et al.2019) reveals that the region between two sub-structures displays a highly inverted spectrum and may be corresponding to the core, which cannot be observed at these radio frequencies due to synchrotron-selfabsorption (Angioni et al.2019).The estimated kinematic age is 70±30 yr via the apparent separation speed of 0.13±0.06c between two mini-lobes(Angioni et al.2019,see also Giroletti& Polatidis 2009).
NGC 3894, located in an elliptical galaxy with redshift of z=0.01075 (Bilicki et al.2014).Its radio spectrum peaks at a frequency near 5 GHz(Taylor et al.1998).The high-resolution Very Long Baseline Array(VLBA)image at 1.4 GHz shows its radio core, the two-sided jets, and a southeast radio lobe with the total linear size of ∼50 mas (Peck & Taylor 1998).The Very Long Baseline Interferometry (VLBI) observations at 5 GHz covering 15 yr demonstrate that the two-sided pc-scale jets emerge from the radio core with a mildly relativistic speed of ∼0.3c (Taylor et al.1998).Principe et al.(2020) reported that its two-sided jets expand to southeast and northwest directions with an apparent separation velocity of 0.202±0.005c between 1995 and 2017 and then estimated its kinematic age to be 59±5 yr.
TXS 0128+554,hosted in an elliptical galaxy with redshift of z=0.0365 (Huchra et al.2012).The turnover frequency of its radio spectrum is less than 1 GHz (Lister et al.2020).Its pcscale radio structure consists of an unresolved bright core and east–west side cambered lobes,and the overall projected extent of its lobes is similar in the multiple-radio-frequency images(Lister et al.2020).With the observations at 2.3 GHz and 5 GHz, the faint steep-spectrum emission is revealed for the regions at 8.8 pc(eastern lobe)and 7.8 pc(western lobe)from the core (Lister et al.2020).Lister et al.(2020) reported an apparent advance speed of 0.32±0.07c of its radio substructure and estimated its kinematic age of 82±17 yr under the assumption of a constant advance speed in the western lobe.
3.Fermi/LAT Data Analysis and Results
3.1.Data Analysis
We use the public software fermitools5https://fermi.gsfc.nasa.gov/ssc/data/analysis/software/(ver.2.0.8, Fermi Science Support Development Team 2019) with the binned likelihood analysis method to analyze the Fermi/LAT Pass 8 data of the three CSOs.The data covering from 2008 August 4 to 2022 May 1 (MJD 54682–59700) are extracted from the Fermi Science Support Center.We set the region of interest as a circle of radius 15°centered on the radio/optical positions of the three CSOs.The photon events in the energy range within 0.1–300 GeV are considered.We filter the background γ-ray contamination from the Earth limb by setting the maximum zenith angle as 90°.The good quality photon events are selected by a standard data quality selection criterion“(DATA_QUAL>0)&&(LAT_CONFIG==1)”.The data are binned with a pixel size of 0°.2 and 25 logarithmic energy bins.The instrument response function P8R3_SOURCE_V3 is used in the data analysis.
The Fermi/LAT 12 yr Source Catalog (4FGL-DR3,Abdollahi et al.2022), the diffuse Galactic interstellar emission(gll_iem_v07.fits),and the isotropic emission(iso_P8R3_SOURCE_V3_v1.txt) are included as background models.In the data analysis, we use the maximum test statistic (TS) to quantify the significance of the γ-ray detection.TS is the logarithmic ratio of the likelihood of a model with the point source to that of a model without the point source, i.e.,(Mattox et al.1996).A threshold of TS>25 is adopted to recognize a point source from the background.By subtracting all the background models, we first generate the 3°×3° residual TS maps to investigate whether there are new γ-ray sources not included in the 4FGL-DR3.No excess γ-ray signal with TS>25 is found in the residual TS maps, indicating that no new additional γ-ray source is detected.We then produce the 2°×2°TS maps of the three 4FGL point sources, 4FGL J1724.2–6501, 4FGL J1149.0+5924, and 4FGL J0131.2+5547.Using the gtfindsrc tool, we also obtain the best-fit positions of the three 4FGL point sources,as shown in Figure 1.Information on the three CSOs and the three associated 4FGL point sources is also given in Table 1.

Figure 1.2°×2°TS maps of the three 4FGL-DR3 point sources with the 68%and 95%containments(black contours)of the best-fit positions.The cyan solid stars represent the radio/optical positions of the three CSOs.The maps are created with a pixel size of 0°.05 and are smoothed.
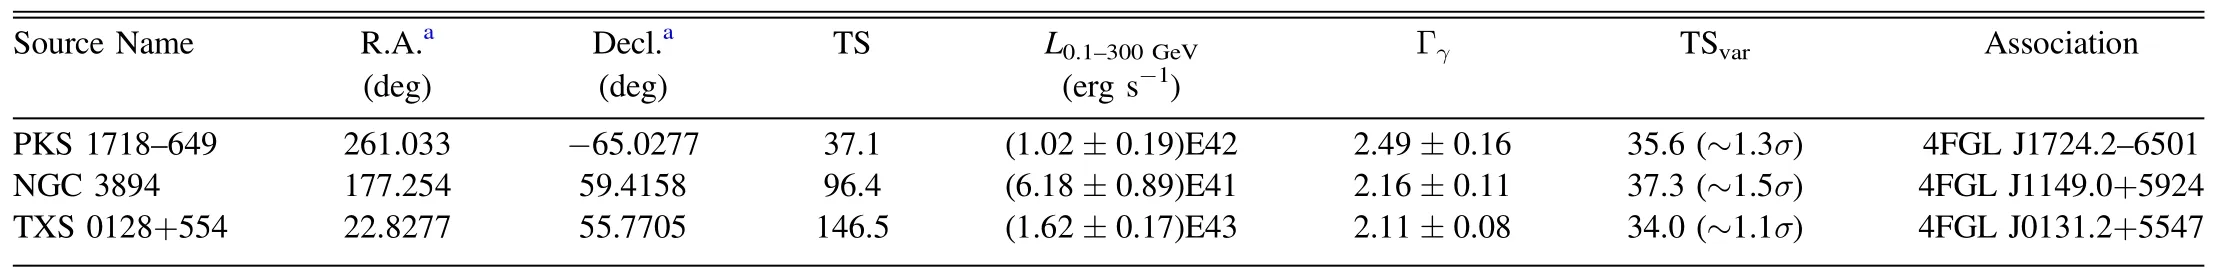
Table 1 Fermi/LAT Analysis Results
During the spectral analysis, the normalization of the isotropic emission and the diffuse Galactic interstellar emission, and the spectral parameters of the γ-ray sources listed in 4FGL-DR3 within the range of 8° remain free, and other parameters are kept fixed.A spectrum should be significantly curved if TScurv>9 (corresponding to a 3σ confidence level,Abdollahi et al.2022), where TSLLPand LPLare the hypothesis likelihoods of LogParabole model and power-law model testing,respectively.The TScurvvalues of the three CSOs are much less than 9, therefore, the power-law spectral model is taken into account to fit their photon spectra in our analysis.The average spectra of the three CSOs with the power-law fits are presented in Figure 2, and the derived parameters are listed in Table 1.We also generate their longterm light curves with the power-law spectral fits, where the equal time interval of 180 days is adopted, as displayed in Figure 2.
We also calculate the corresponding variability index TSvar,a common method to estimate the γ-ray variability (Abdollahi et al.2022).The definition of TSvaris
where Fiis the fitting flux for bin i, Li(Fi)is the likelihood corresponding to bin i, Fglobis the best-fit flux for the global time by assuming a constant flux, and N is the number of time bins.We keep only the normalization of the target source free to vary and fix other parameters to the best-fit values during calculations.TSvar=53.0 corresponds to a 3σ confidence level in thedistribution with N-1=26 degrees of freedom, where N=27 is the number of time bins.The γ-ray emission of a source is probably variable when TSvar>53.0.The obtained TSvarvalues are listed in Table 1, and the corresponding confidence levels of variability are also given.
3.2.Analysis Results
PKS 1718–649.By analyzing the ∼14 yr Fermi/LAT observation data, a γ-ray detection with TS ∼37 is yielded for PKS 1718–649.As shown in Figure 1,the radio position of PKS 1718–649 falls within the 68% error circle of the best-fit position of 4FGL J1724.2–6501.Our result is coincident with the previous report that PKS 1718–649 is spatially associated with the γ-ray point source 3FGL J1728.0–6446(Migliori et al.2016), where 3FGL J1728.0–6446 is associated with 4FGL J1724.2–6501 in the 4FGL-DR3 (Abdollahi et al.2022).PKS 1718–649 has a steep spectrum at the GeV band with a photon spectral index of Γγ=2.49±0.16.Its ∼14 yr average luminosity at the GeV band is (1.02±0.19)×1042erg s-1.No obvious variability is observed with TSvar=35.6,only four detection points are presented in the whole light curve,and the first three detection points are obtained with the first 7 yr observations.Using the 7 yr data set, Migliori et al.(2016)therefore found the γ-ray signal of PKS 1718–649 with the same TS value (TS ∼36) as ours.

Figure 2.Left column: the ∼14 yr Fermi/LAT average spectra along the power-law function fit results.Right column: the long-term Fermi/LAT light curves with time bins of 180 days.The horizontal red dashed lines represent the ∼14 yr average γ-ray luminosity of sources,and the red data points in the light curves denote the last residual time interval, only 157 days.The opened inverted triangles indicate the TS value of that energy/time bin less than nine.
NGC 3894.A significant γ-ray signal with TS=96.4 is detected around NGC 3894.The radio position of NGC 3894 is located at the 68%containment of the best-fit position of 4FGL J1149.0+5924, as displayed in Figure 1.Its spectrum at the GeV band is flatter than that of PKS 1718–649, i.e.,Γγ=2.16±0.11, which is slightly steeper than the derived value of Γγ=2.01±0.10 with the 10.8 yr observation data in Principe et al.(2020).NGC 3894 has the lowest γ-ray luminosity among the three CSOs, being (6.18±0.89)×1041erg s-1.The confidence level of the flux variation is less than 2σ, also indicating no variability in its γ-ray emission.
TXS 0128+554.The analysis with the ∼14 yr Fermi/LAT observation data yields a significant γ-ray detection with TS=146.5 for TXS 0128+554.It has the highest γ-ray luminosity of (1.62±0.17)×1043erg s-1and the flattest spectrum with Γγ=2.11±0.08 among the three CSOs.Same as PKS 1718–649 and NGC 3894,no significant flux variation of γ-rays more than the 2σ confidence level is observed for TXS 0128+554.
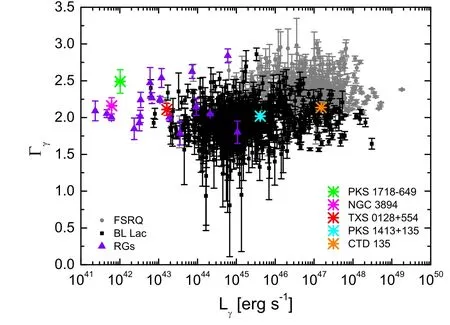
Figure 3.The photon spectral index(Γγ)vs.the γ-ray average luminosity(Lγ)in the LAT energy band.The data of blazars and RGs are taken from 4FGLDR3.The data of CTD 135 and PKS 1413+135 are from Gan et al.(2021, 2022).
Note that Principe et al.(2021) investigated the γ-ray emission of some young radio sources by analyzing the 11 yr Fermi/LAT data.They reported that TS=36 and Γγ=2.60±0.14 for PKS 1718–649, TS=95 and Γγ=2.05±0.09 for NGC 3894, TS=178 and Γγ=2.20±0.07 for TXS 0128+554, and found no evidence of significant γ-ray variability for the three CSOs.These results are consistent with our analysis results.
3.3.The Lγ-Γγ Plane
As described above, the γ-ray average spectra of the three CSOs can be well fitted with a power-law function, none of them displays the significant flux variation in the GeV band,and all of them show the low γ-ray luminosity.These are dramatically different from the γ-ray emitting CSOs CTD 135 and PKS 1413+135, both of them show the Log-parabola spectra, violent variability, and high luminosity in the GeV band, similar to blazars (Gan et al.2021, 2022).The diversity of the γ-ray emitting CSOs is also displayed in the Lγ-Γγplane, where Lγis the γ-ray luminosity in the GeV band, and the data of blazars and RGs are taken from the 4FGL-DR3(Abdollahi et al.2022).As illustrated in Figure 3, blazars together with CTD 135 and PKS 1413+135 occupy the highluminosity area of the figure while RGs and three CSOs studied in this work are located at the low-luminosity region.It is widely known that blazars demonstrate frequent and violent variabilities, especially in the γ-ray band, favoring a compact emission region with the significant Doppler boosting effect.Similarly, the high-luminosity γ-ray emission of CTD 135 and PKS 1413+135 is due to the episodic nuclear jet activities and is generated from a new-born aligned core-jet (Gan et al.2021, 2022).In contrast, RGs normally have the low luminosity and weak variability, and they are thought to be the parent populations of blazars with large viewing angles and small Doppler factors(Urry&Padovani 1995).Accordingly,it is still an open question whether the γ-rays of RGs originate from the jet with a large inclination angle or the large-scale jet extended regions.In the LAT band, Fornax A shows no significant variability while Cen A only displays some flux variation at a ∼3.5σ confidence level in the low-energy band(Brown et al.2017; Abdollahi et al.2022).In particular, the Fermi/LAT observations definitively demonstrate the γ-rays from the large-scale lobes of Cen A and Fornax A, to account for more than 50% and 86% of their total γ-ray flux,respectively (Abdo et al.2010; Ackermann et al.2016).Thereby, the γ-rays of Cen A and Fornax A are lobedominated.Recently, the γ-ray emission from FR II RG IGR J18249-3243 was also found to be lobe-dominated(Bruni et al.2022).In view of no obvious γ-ray variability and the lobedominated radio emission for TXS 0128+554,PKS 1718–649,and NGC 3894,similar to these RGs,we speculate that their γrays stem from the extended mini-lobes.
4.Discussion
4.1.Broadband SED Modeling and γ-ray Origin
In order to further explore the γ-ray emission properties of the three CSOs, we collect the low-energy band data from literature and the NASA/IPAC Extragalactic Database (NED)as well as the ASI Science Data Center (ASDC) and construct their broadband spectral energy distributions (SEDs), as displayed in Figure 4.A detailed description of data is in the caption of Figure 4.Considering the similar radiation properties of the three CSOs to RGs Cen A and Fornax A, the lobedominated emission in the radio band, and no significant variability in the GeV band,we thus infer that the γ-rays of the three CSOs are also dominated by the extended region.Due to the broad second bump in the broadband SEDs of the three CSOs, we thus intend to represent their SEDs with the twozone leptonic model, similar to that in other γ-ray emitting compact radio sources(e.g.,Zhang et al.2020;Gan et al.2021,2022;Gu et al.2022).The synchrotron(syn),synchrotron-self-Compton (SSC), and external Compton (EC) scattering of the relativistic electrons in both the core and extended region are considered.The synchrotron-self-absorption(SSA)effect at the low-energy band, the Klein–Nishina effect at the high-energy band, and the absorption of high-energy γ-ray photons by extragalactic background light (EBL; Franceschini et al.2008)are also taken into account during the SED modeling.
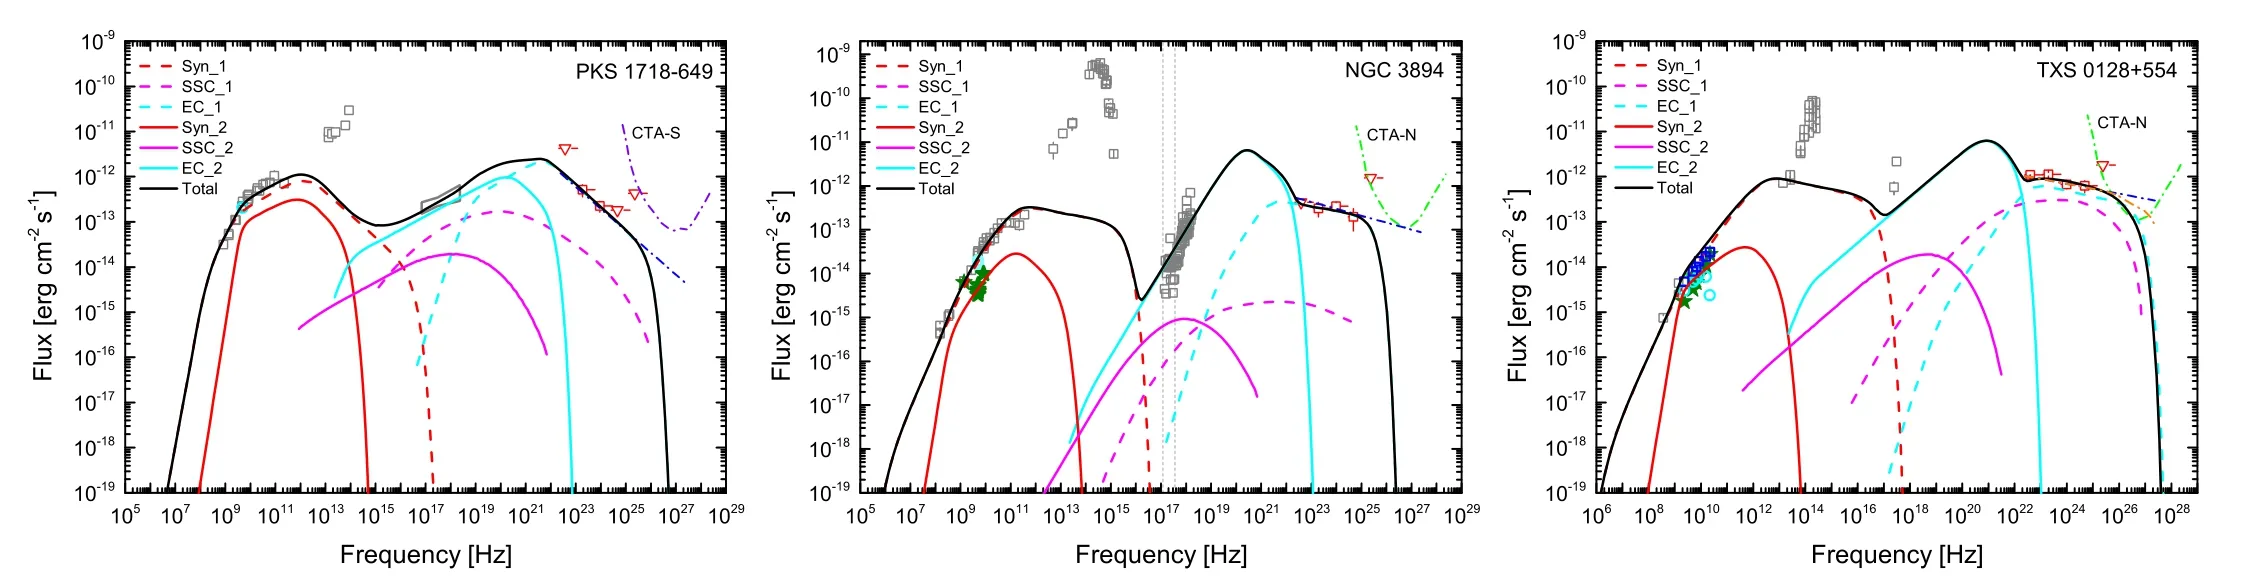
Figure 4.Observed SEDs with the two-zone(“1”for the extended region and“2”for the core region)leptonic model fitting results.The data marked as opened gray squares are taken from the NED, ASDC, and literature (Balasubramaniam et al.2021; Sobolewska et al.2022).The red squares and inverted triangles denote the Fermi/LAT average spectra obtained in this work.The olive stars(core)and the opened cyan circles(lobe)represent the flux of core and lobe,respectively,which are collected from the NED and literature (Tingay et al.1997;Taylor et al.1998;Lister et al.2020).The opened blue squares indicate total flux taken from Lister et al.(2020).The blue dashed–dotted lines show the extrapolated VHE spectra from the Fermi/LAT spectra,while the orange dashed–dotted line in TXS 0128+554 panel represents the extrapolating VHE spectrum considered the EBL absorption.The data of the soft X-ray band between two vertical lines for NGC 3894are not considered during SED modeling.
The electron distributions in both the core and extended regions are assumed as a broken power-law, which are characterized by a density parameter N0, a break energy γb,and indices p1and p2in the energy range of [γmin,γmax].The radiation region is assumed as a sphere with radius R,magnetic field B, and Doppler factor δ.Since the mildly relativistic motions have been observed and reported for NGC 3894(Principe et al.2020) and TXS 0128+554 (Lister et al.2020),we take their relativistic effect into account for both the core and extended regions,i.e.,δ=1.3 and Γ=1.04 for NGC 3894(Principe et al.2020),δ=1.2 and Γ=1.06 for TXS 0128+554(corresponding to a viewing angle of θ=52°, Lister et al.2020),where Γ is the bulk Lorenz factor.The jet is accelerated and collimated reaching up to sub-pc/pc scale (see Boccardi et al.2017 for a review).After the acceleration phase, the jet assumes a conical shape and initiates deceleration as a logarithmic function of distance (r) from the black hole (see Potter&Cotter 2013;Wang et al.2022).We assume the same value of Γ for both the core and extended regions due to the total projection size of NGC 3894 and TXS 0128+554 being less than 20 pc.Assuming the same advance speed for the twosided mini-lobes,an apparent advance velocity of only ∼0.06c is observed for PKS 1718–649 (Angioni et al.2019), we thus take Γ=δ=1 for both the core and extended regions during SED modeling.For the core region, we take R=δcΔt/(1+z)and Δt=180 days.Due to the absence of apparent variability in the γ-ray light curves, the time-bin value of the light curves is adopted, similar to other compact radio sources emitting γrays (Zhang et al.2020).In this case, R>0.1 pc, the energy dissipation region should be located at ∼10 ∗R from the black hole and outside of the broad-line regions,and the photon field of torus provides the dominant seed photons of the EC process(see Ghisellini & Tavecchio 2009).The overall projection size of the radio morphology of the three CSOs is all less than 20 pc.The seed photon field of the EC process is still dominated by the photons from torus within this scale(Ghisellini & Tavecchio 2009, see also Stawarz et al.2008).We thus only consider the external photon field of torus to calculate the EC process for both the core and extended region.The typical energy density of the torus photon field of UIR=3×10⁻⁴erg cm-3(Cleary et al.2007; Kang et al.2014)is taken for the core region,whereas the values of UIRfor the extended regions are estimated according to Equation (21)in Stawarz et al.(2008) and are given in Table 4.For the core region,γmin= 1andγmax= 104are set.p1is roughly estimated by the spectral index of the X-ray observation data while p2=4 is fixed.γb, N0, and B are free parameters.For the extended region, R is equal to the total projection size of the radio morphology,as listed in Table 2.γminis taken as 300 or 500 to match the observation data at the radio band andγmaxis set asγmax= 100γb(roughly constrained by the last upper-limit data point in the Fermi/LAT spectrum).p1and p2are constrained by the radio and γ-ray spectral indices,respectively.γb,N0,and B are also free parameters.As shown in Figure 4, the observational data at the near-IR-optical band are dominated by the starlight of host galaxy.The data of the soft X-ray band(0.5–1.5 keV) for NGC 3894 are not corrected the absorption(Balasubramaniam et al.2021).We thus do not take these data into account during the SED modeling.Due to the limited observation data, we cannot give a constraint on the fitting parameters, and we only obtain a set of model parameters that can make an acceptable fit.We also plot a cartoon illustration for the radiation model, as depicted in Figure 5.
The fitting results are presented in Figure 4 and the modeling parameters are given in Table 2.The broadband SEDs of the three CSOs can be well explained by the two-zone leptonic radiation model.Under this scenario, the γ-rays are produced by the IC process of the relativistic electrons in the extended region and the X-rays are dominated by the radiation of thecore region.As listed in Table 2, the derived B values of core regions are higher than that of extended regions while γbof the core is smaller than that of the extended region.We find that the magnetic field strengths between the core region (B1) and the extended region (B2) for the three CSOs basically satisfy the relation of B1/B2=r2/r1,where r1and r2are the distances from the core and the extended regions to the black hole,respectively.This result is consistent with the VLBA observations for some AGN jets (O’Sullivan & Gabuzda 2009).The derived B values of extended regions are several mG, being in agreement with the typical values measured in CSOs (Orienti et al.2006;Lister et al.2020).As listed in Table 2,γmax~106is required to account for the γ-ray emission originating from these extended regions of CSOs.The detection of GeV γ-rays in the large-scale lobes of RGs Cen A and Fornax A (Abdo et al.2010; Ackermann et al.2016) provides compelling evidence for the acceleration of ultrarelativistic electrons in the extended regions of AGN jets, particularly highlighted by the very high-energy detection along the jet of Cen A (H.E.S.S.Collaboration et al.2020).The leptonic radiation model employed to explain that the observed γ-ray flux from these extended regions of AGN jets requires electron Lorentz factors on the order of 106(Persic & Rephaeli 2019), or even higher(107–108; H.E.S.S.Collaboration et al.2020).
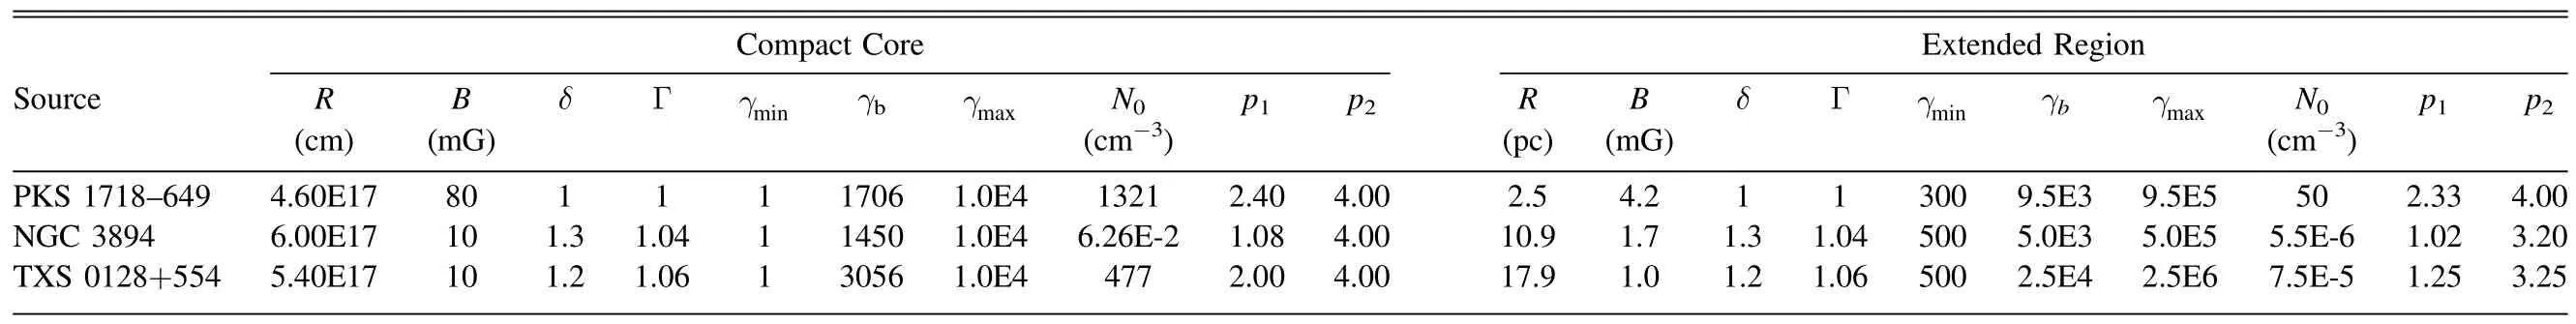
Table 2 SED Fitting Parameters
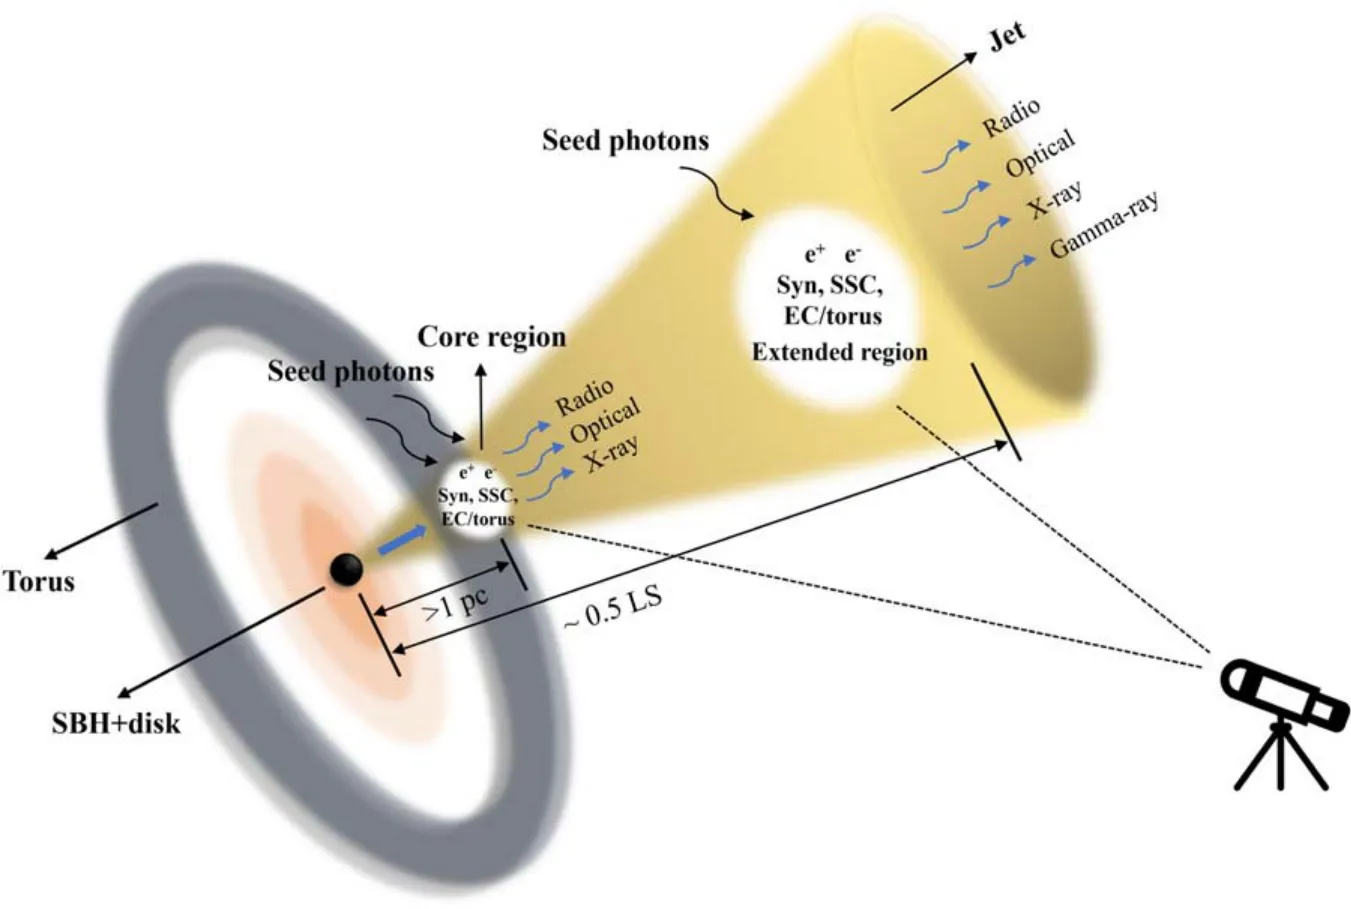
Figure 5.A cartoon illustration of the two-zone leptonic radiation model.The distance between the core region and the black hole is conservatively estimated to be greater than 1 pc,with a rough approximation of 10 ∗R.The distance between the extended region and the black hole is approximately half of the total projection size of the radio morphology, where the term “LS” refers to the overall projection size of sources.
It should be noted that we used a phenomenological electron spectrum, a broken power-law spectrum, to model the SEDs here.Although a power-law electron spectrum with an exponential cut-off would be more naturally motivated by the particle acceleration theory, a broken power-law electron spectrum can better represent the symmetric peaks in the observed SEDs (e.g., Aharonian et al.2009; Ghisellini &Tavecchio 2009; Chen et al.2012; Zhang et al.2012; Aleksić et al.2014).It is unclear whether the electron distribution has a low-energy cutoff withγmin> 1in theory;generally,it is fixed asγmin= 1(e.g., Ghisellini & Tavecchio 2009; Zhang et al.2012).Sometimes,γmincan be roughly constrained with X-ray data (e.g.,Tavecchio et al.2000; Zhang et al.2014), or a lowenergy cutoff in the electron spectrum is required to explain the radio spectra of some large-scale jet substructures, withγminbeing several hundreds (Harris et al.2000; Hardcastle et al.2001; Lazio et al.2006; Godfrey et al.2009).During SED modeling,γmaxnormally is constrained by the last observation point in the γ-ray band.The theoretical upper limit of the maximum electron energyγmaxcan be determined by tacc=min (tesc, tcool), where tacc, tesc, tcoolare the timescales of acceleration, escape and cooling, respectively.We estimated the three theoretical timescales using the Equations from Wang et al.(2022), and found that the derived values ofγmaxfrom SED modeling are much smaller than the theoretical upper limit ofγmax.In addition,γbderived from SED modeling is not exactly the same as the cooling break since γbresults from a complex physical process, including the adiabatic losses, the particle escape, and the cooling (e.g., Ghisellini & Tavecchio 2009).
The energy densities of the non-thermal electrons (Ue) and magnetic fields (UB) of extended regions are also listed in Table 4.The ratio of Ue/UBof the three CSOs is close to that of the lobes in Cen A and Fornax A,which are also derived bythe SED modeling (Persic & Rephaeli 2019), and is also in agreement with the values in the radio lobes of some RGs,which are obtained by the X-ray measurements (e.g., Croston et al.2005; Kataoka & Stawarz 2005; Isobe et al.2011).
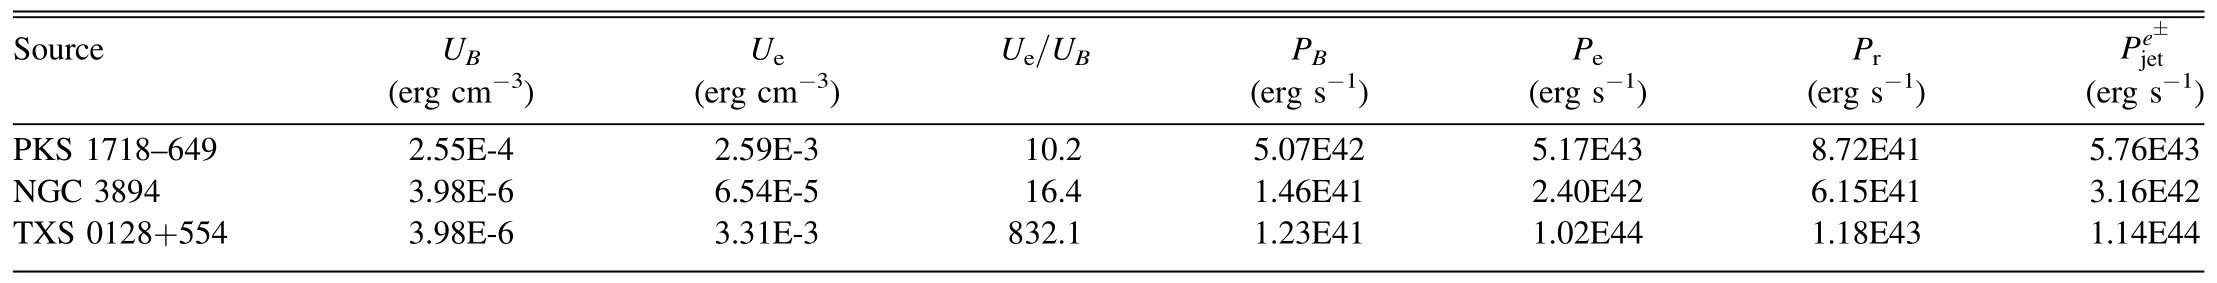
Table 3 Derived Parameters of the Core Region
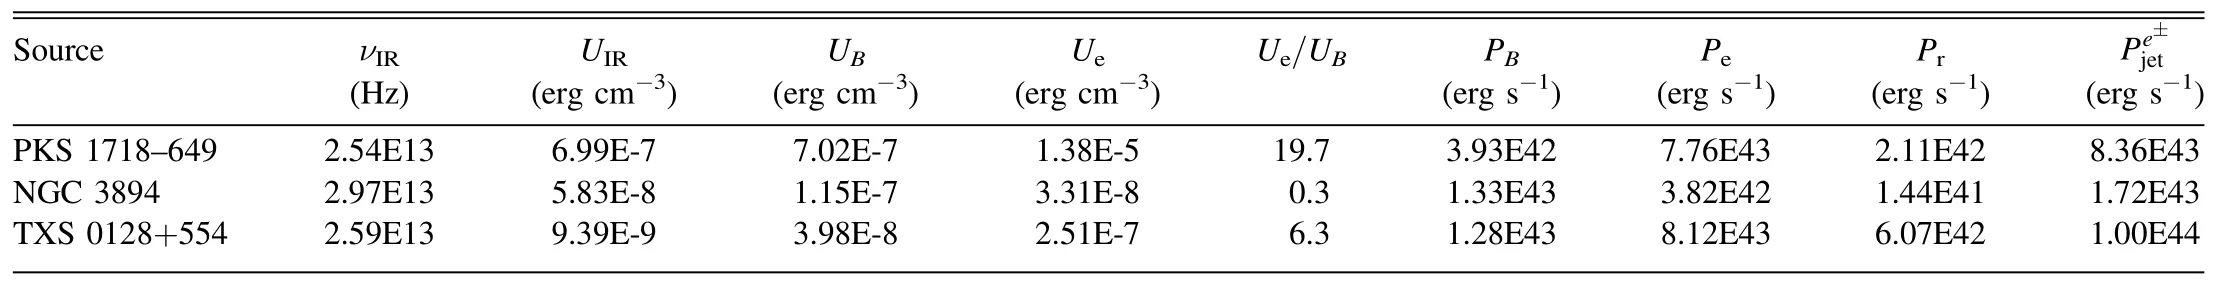
Table 4 Derived Parameters of the Extended Region
4.2.Possible VHE Emission
Recently, CSO PKS 1413+135 is detected at the very high energy(VHE)band by the MAGIC telescope(Blanch et al.2022;Gan et al.2022).Although the γ-rays of PKS 1413+135 should be dominated by an aligned jet emission and may be totally different from the three lobe-dominated CSOs, we are still wondering whether the three CSOs could be detected at the VHE band.In particular, the H.E.S.S.Collaboration reported that Cen A has the VHE emission along its large-scale jet,providing direct evidence for the presence of high-energy electrons in the extended regions of AGN jets (H.E.S.S.Collaboration et al.2020).
Extrapolating the Fermi/LAT γ-ray spectrum in the VHE band is a common method to estimate the intrinsic VHE spectrum of sources(Paiano et al.2021;Zhu et al.2021;Malik et al.2022).As described in Section 3.2, the spectra observed by the Fermi/LAT for the three CSOs are well represented by a power-law function, and no evidence of variability has been found in their long-term γ-ray light curves.We therefore directly extend the power-law spectra at the GeV band to the VHE band for the three CSOs, as illustrated in Figure 4.The sensitivity curves of Cherenkov Telescope Array south and north (CTA-S and CTA-N, 50 hr) are also presented in Figure 4, where the sensitivity curves are obtained from the CTA webpage.6https://www.cta-observatory.org/science/cta-performance/It can be found that the extrapolated flux at the VHE band of PKS 1718–649 and NGC 3894 is below the sensitivity curve of CTA.Especially for PKS 1718–649,together with its steep spectrum at the GeV band, it would be difficult to be detected by the CTA in the future.The extrapolated intrinsic VHE spectrum of TXS 0128+554 clearly surpasses the sensitivity curve of the CTA; however, when considering the EBL absorption, it only marginally intersects with the CTA’s sensitivity curve, as depicted in Figure 4.Nevertheless, theoretical suggestions have proposed episodic jet activity for compact radio sources (e.g., Reynolds &Begelman 1997; Czerny et al.2009), and the episodic nuclear jet activity has been reported for TXS 0128+554 (Lister et al.2020).The reactivation of TXS 0128+554 could position it as a potential candidate for VHE emission, making it detectable by the CTA.
5.Summary
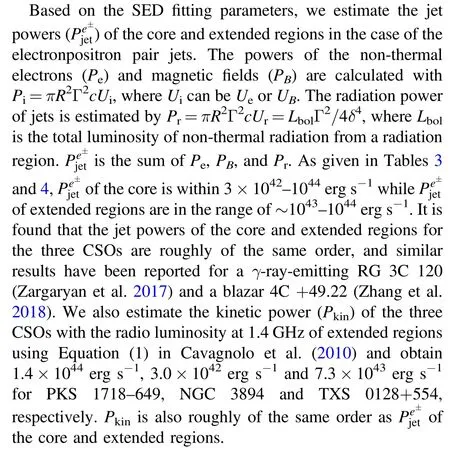
We completely analyzed the ∼14 yr Fermi/LAT observation data of three radio-lobe-dominated CSOs(PKS 1718–649,NGC 3894, TXS 0128+554) to explore their γ-ray emission properties.They are all characterized by a low γ-ray luminosity(1041–1043erg s-1),their average spectra in 0.1–300 GeV can be well fitted by a power-law function,and no significant variability is observed in their long-term γ-ray light curves.These γ-ray features are prominently different from those of the γ-ray emitting CSOs PKS 1413+135 and CTD 135.In the Lγ-Γγplane,the three CSOs are located at the region occupied by RGs,also distinctly different from PKS 1413+135 and CTD 135,which are similar to blazars.Considering the similar radiation properties between the three CSOs and the γ-ray emitting RGs,specifically similar to RGs Cen A and Fornax A,together with no significant variability in the γ-ray band and no superluminal motion at the radio band, we speculated that their γ-rays stem from the lobe-dominated radiation, different from CTD 135 and PKS 1413+135(Gan et al.2021,2022).Their broadband SEDs can be represented by the two-zone leptonic model and γ-rays are produced by the IC processes of the relativistic electrons in extended regions.The γ-rays are produced by the IC process of the relativistic electrons in extended regions and the X-rays are dominated by the radiation of the core region.This radiation model can be checked by studying whether the flux variations in X-ray and γ-ray bands are correlated.Based on the derived fitting parameters,we calculated the jet powers of the core and extended regions by assuming the electron-positron pair jet and found that the jet powers of the core and extended regions for the three CSOs are roughly of the same order.TXS 0128+554 may be a VHE emission candidate and be detected by CTA in the future.
Acknowledgments
We thank the kind permission for the usage of the RFC data from the RFC Collaboration.This research has made use of the NASA/IPAC Extragalactic Database, which is funded by the National Aeronautics and Space Administration and operated by the California Institute of Technology.This work is supported by the National Natural Science Foundation of China (grants 12022305, 11973050, and 12203022).
 Research in Astronomy and Astrophysics2024年2期
- Research in Astronomy and Astrophysics的其它文章
- A Fermi-LAT Study of Globular Cluster Dynamical Evolution in the Milky Way: Millisecond Pulsars as the Probe
- Application of Regularization Methods in the Sky Map Reconstruction of the Tianlai Cylinder Pathfinder Array
- Effect of Cosmic Plasma on the Observation of Supernovae Ia
- Variable Stars in the 50BiN Open Cluster Survey.III.NGC 884
- Free Energy of Anisotropic Strangeon Stars
- Data-driven Simulations of Magnetic Field Evolution in Active Region 11429:Magneto-frictional Method Using PENCIL CODE