
Variation in the Flaring Potential of Different Sunspot Groups During Different Phases of Solar Cycles 23 and 24
2024-03-22 04:11AbhaSinghAnuragChaudhariGyaneshwarSharmaandSingh
Abha Singh, Anurag Chaudhari, Gyaneshwar Sharma, and A.K.Singh
1 Department of Physics, T.D.P.G.College Jaunpur—222002, India
2 Department of Physics, Banaras Hindu University, Varanasi—221005, India; singhak@bhu.ac.in
Abstract In this present study,we have analyzed different types of X-ray solar flares(C,M,and X classes)coming out from different classes of sunspot groups (SSGs).The data which we have taken under this study cover the duration of 24 yr from 1996 to 2019.During this, we observed a total of 15015 flares (8417 in SC-23 and 6598 in SC-24)emitted from a total of 33780 active regions(21746 in SC-23 and 12034 in SC-24)with sunspot only.We defined the flaring potential or flare-production potential as the ratio of the total number of flares produced from a particular type of SSG to the total number of the same-class SSGs observed on the solar surface.Here we studied yearly changes in the flaring potential of different McIntosh class groups of sunspots in different phases of SC-23 and 24.In addition,we investigated yearly variations in the potential of producing flares by different SSGs(A,B,C,D,E,F, and H) during different phases (ascending, maximum, descending, and minimum) of SC-23 and 24.These are our findings: (1) D, E, and F SSGs have the potential of producing flares ≥8 times greater than A, B, C and H SSGs;(2)The larger and more complex D,E,and F SSGs produced nearly 80%of flares in SC-23 and 24;(3)The A,B,C and H SSGs,which are smaller and simpler,produced only 20%of flares in SC-23 and 24;(4)The biggest and most complex SSGs of F-class have flaring potential 1.996 and 3.443 per SSG in SC-23 and 24,respectively.(5)The potential for producing flares in each SSG is higher in SC-24 than in SC-23,although SC-24 is a weaker cycle than SC-23.(6) The alterations in the number of flares (C+M+X) show different time profiles than the alterations in sunspot numbers during SC-23 and 24, with several peaks.(7) The SSGs of C, D, E, and H-class have the highest flaring potential in the descending phase of both SC-23 and 24.(8)F-class SSGs have the highest flaring potential in the descending phase of SC-23 but also in the maximum phase of SC-24.
Key words: (Sun:) sunspots – Sun: flares – Sun: activity – Sun: magnetic fields – Sun: filaments – prominences
1.Introduction
The dynamo mechanism happening in the core is responsible for the different activities of the Sun.Sunspots on the chromosphere of the Sun are a visual indicator of its activity.There is a very strong magnetic field in sunspot regions; the temperature of these regions is lower than their surroundings so they appear dark in comparison to other regions.The temperature of sunspots is low because the convection process of energy is very much suppressed in plasma embedded in the magnetic field.Due to this,the energy could not come out from these regions and their temperature seems lower than their surroundings.The Sun is continuously rotating, so the sunspot regions are also moving with it on the visual disk.Sunspots are a temporary phenomenon whose shape, size, magnetic field polarity,location,etc.,vary continuously.Sunspots can remain present for a small number of days or a couple of weeks, and even sometimes for up to a month.Scientists have been taking data on sunspots for nearly 400 yr, after the invention of the telescope, around the year 1610 (Eddy 1976; Vaquero et al.2007),to understand the activity going on in the Sun.From the interior of the Sun, a magnetic field with very high magnitude emerges and appears on the Sunʼs surface as dark spots,known as sunspots(Wang et al.2005).Sunspots can appear singly,in pairs, or more than two at a place.The sunspot number (SSN)is correlated with different solar activity parameters like solar wind parameters (Ahluwalia 2011), galactic cosmic rays(GCRs) in the Earth orbit (Forbush 1966), interplanetary magnetic field (IMF) B (Ahluwalia 2013) and geomagnetic indices Ap/aa (Mayaud 1972).Numerous studies have been conducted that show, through quantitative calculations, that sunspot rotation contributes to the movement of energy and helicity from the photosphere to the interior of the Sun’s corona(Kazachenko et al.2009; Vemareddy et al.2012) and also by analyzing observational data it has been confirmed that there is a temporal and spatial relationship between solar flares and sunspot rotation(Zhang et al.2007;Yan&Qu 2007;Yan et al.2008a,2008b,2009,Jiang et al.2012).Based on morphology,SSGs have been classified into different classes.First, Cortie(1901) classified groups of sunspots into five categories; again Waldmeier (1938) recommended a new classification of nine categories (A, B, C, D, E, F, G, H, and J) for sunspot groups(SSGs), known as Zurich classification.Lastly, McIntosh(1990) made alterations in Zurich’s classification to describe the connection of diverse SSGs with X-ray solar flares and explained the most important characteristics of sunspots like class, size, magnetic complexity, etc.The newly reorganized Zurich (also known as McIntosh) classification consists of seven SSG classes: A, B, C, D, E, F, and H.
Regions on the Sunʼs surface where sunspots are observed are known as solar active regions (ARs).These ARs might be with or without sunspots and can produce solar flares, coronal mass ejections(CMEs),etc.The magnetic field of solar ARs is very complex and stressed.The morphology of a group of sunspots and associated ARs is correlated with the incidence of X-ray solar flares (Bornmann 1992).The tendency to produce solar flares by ARs is determined by the level of complexity of the magnetic field since intense flares (M and X) are mostly produced by ARs with a very complex magnetic field and weak flares (A, B, and C) are produced by ARs with less complex magnetic field configurations.The NOAA Space Weather Scale (https://www.swpc.noaa.gov/) states that solar X-ray flare events below M-class do not affect Earthʼs communications and navigation systems significantly.
During the production of solar flares over a vast range of wavelengths (Švestka 1966), the brightness of the chromosphere suddenly increases; we can observe this on the disk of the Sun.When flares emerge from the Sun,we can also observe Solar Energetic Particles and CMEs, which are not associated with flares directly.When an embedded materialʼs energy becomes greater than the energy of suppression of a complex magnetic field, it ejects out of the chromosphere into interplanetary space.During the eruption of solar X-ray flares,a very large quantity of energy of order 1027–1032erg is emitted, depending on which class of flare is being produced(Fletcher et al.2011).These flares affect the whole outer,nearspace environment and infrastructure (mobile towers, electricity grids,satellites,etc.)on the Earth.During the emergence of flares from the Sun, a huge amount of solar materials, such as heavy ions,electrons,and protons,is produced,which might be moving at nearly the speed of light.With these events, a large amount of magnetic energy is also released in the form of electromagnetic energy, which has a wide spectrum.Highenergy solar flares are generally associated with faster CMEs(Moon et al.2002; Youssef 2013).Earthward-erupting CMEs can cause a geomagnetic storm of moderate or severe category,which might be destructive to the Earthʼs space environment and infrastructure such as communication systems, pipelines,mobile towers, electronic systems, Global Positioning System navigation, etc.
There have been many studies analyzing the correlation between different classes of flares and different parameters of solar activity, temporal and spatial distributions of the Sunʼs flares, and ionospheric disturbances (e.g., Donnelly 1976;Garcia 1990;Švestka 1995;Joshi 1995;Li et al.1998;Temmer et al.2000; Atac & Özgüç 2001; Joshi & Joshi 2004; Joshi et al.2006;Temmer et al.2006;Belucz et al.2013;Chowdhury et al.2013; Xiong et al.2011, 2014a, 2014b, 2014c, 2019;Belucz et al.2015; Chen et al.2016; Abdel-Sattar et al.2018;Joshi & Chandra 2019).The strong flares mostly take place from complex SSGs.Carrington (1859) and Hodgson (1859)independently investigated the first observed solar flare in 1859 which was viewed as an increase in brightness.
The Hα wavelength emitted in the chromosphere has been observed since 1920 when Hale (1920) invented the spectrohelioscope.During observation of Hα, white light flares are occasionally also observed.To indicate the size and optical brightness of a flare,a code composed of two codes,known as“importance,” is used.The first code of “importance” is a number ranging from 1 to 4, which indicates an apparent area of the flare.Subflares with areas are signified by the letter“S.”The second code (f, n or b) is used to indicate the relative brilliance of a flare or subflare, where f, n or b is used to tell whether the flare is faint, normal or bright, respectively.There are a total of 15 codes for labeling the “importance” of flares:Sf, Sn, Sb, 1f, 1n, 1b, etc.X-ray radiation also is emitted with the emergence of solar flares.By measuring the energy strength of these X-ray solar flares, we can classify them into five different groups represented by the letters A, B, C, M, and X,of which A and X-class are the weakest and strongest flares,respectively.Each letter of this series A, B, C, M, and X is related to the powers -8, -7, -6, -5, and -4 Wm-2of 10,respectively.Different agencies are continuously monitoring the flux strength of X-ray flares using their geostationary satellites,which frequently indicate the highest flux of an X-ray flare.The X-ray solar flares of different classes, as discussed above, have been defined as follows:
(i) A-class: These are the weakest and are generally known as subflares.
(ii) B-class: These are small-sized and have a negligible effect on the Earth.We may consider these also as subflares.
(iii) C-class: These are small flares without plasma ejection and have small noticeable effects on the Earth.
(iv) M-class: These are medium-sized flares.These may be associated with a CME and cause short radio blackouts.
(v) X-class:These are large-sized,very powerful flares,and a large amount of plasma material comes out of them.Generally, a CME is also associated with them, which may cause intense geomagnetic storms and long-lasting radio blackouts.
The flares of A, B, C and M–class are further divided into ten equally separated subclasses, while on the contrary X-class remains open-ended.Each X-class is ten times more powerful than the previous one, having the highest flux of nearly 10-4Wm-2.
The group of sunspots identified as“Large and Complex”is correlated with the Ap and Dst index in a better way in comparison with SSN, unlike “Small and Simple” group sunspots.(Lou 2000; Zharkov et al.2007).Sammis et al.(2000) analyzed the rate of occurrence of higher-class X-ray flares on the basis of magnetic classes and the sunspot group’s area (SSGA).They ascertained that the size of a flare is proportional to the SSG’s size.Lee et al.(2012) separated the groups of sunspots into two classes “Large” and “Small”depending on their area.The area of ARs’ of SSG can be of three types: decreasing, steady and increasing.The probability of producing solar flares increases as SSGA increases.Shibata et al.(2013)investigated stars like the Sun having large sunspot areas using data obtained from the “Kepler” satellite regarding the production of a superflare.They found that a highly active sunspot region can generate a flare with very high energy.The energy of these flares may be greater than the energy of the maximum energetic solar flare observed until now, and these flares should be called “superflares.” A superflare can be generated by the Sun one single time in 800 yr.From a mathematical analysis, Aulanier et al.(2013) reported that the energy of the largest possible flare may be six times greater than the latest observed flareʼs highest energy.
Our present study focuses on the soft X-ray flare(C,M,and X-class)productivity of McIntosh-classified SSGs(A,B,C,D,E, F, and H) during different phases (ascending, maximum,descending, and minimum) of solar cycle SC-23 and 24.We have grouped McIntosh classified sunspots into two types,small-simple, and large-complex, depending upon their X-ray flare production capacity as discussed by Kilcik et al.(2011).The proportion of the number of flares produced from a particular SSG with the number of that particular SSG observed in the stipulated time duration has been defined as flaring potential.Previous studies in this area were done for shorter durations(Lee et al.2012)or concentrated on intense flares(M and X-class) only (Hudson et al.2014).Here we consider a 24 yr time duration (from 1996 to 2019) covering SC-23 and 24, which comprised of a broad range of flares (C, M, and X-class) related to different sunspot regions.
2.Sunspot Classification
Here we have considered the latest categorization of SSGs presented by McIntosh (1990), also known as the altered Zurich categorization of SSGs.
2.1.McIntosh (Modified Zurich) Categorization
In the McIntosh categorization,the SSG of G-class in Zurich categorization was joined together with the E and F-classes,and the J-class SSG was joined together with the H-class SSG.Due to this, the finally altered Zurich categorization by McIntosh, also known as “McIntosh categorization,” depends on three different components, as generally signified by Zpc,where “Z” depends on the morphology and evolution of the SSG, “p” denotes the type of main spot, which essentially describes the penumbra and“c”denotes the level of complexity of the sunspot distribution in the interior of the group.This system was illustrated in Figure 1 of McIntosh (1990).Based on parameter “Z” the SSGs have been split into seven categories.
(i) A: It is a unipolar SSG not having a penumbra and represents either the initial or final stage of the SSGʼs development.
(ii) B:It is a bipolar SSG not having a penumbra around any sunspot.
(iii) C:It is a bipolar SSG having a penumbra at either end of the SSG, and in extreme cases, the penumbra surrounds the leading umbrae which is the largest.
(iv) D:It is a bipolar SSG having a penumbra of spots at both ends, with length ≥10°.
(v) E:It is a bipolar SSG having a penumbra of spots at each end of the SSG, with 10°l length ≤15°.
(vi) F:It is a bipolar SSG having a penumbra around spots at each end and length ≥15°.
(vii) H: It is a unipolar SSG having a penumbra.
The second component“p”describes the penumbra around the largest spot of an SSG.This parameter has six different groups,which are “x, r, s, a, h and k.” The third component “c”describes how sunspots are distributed in a group.Depending upon the parameter “c” there are four types of SSGs: “x, o, i,and c.”
3.Data Selection and Method of Analysis
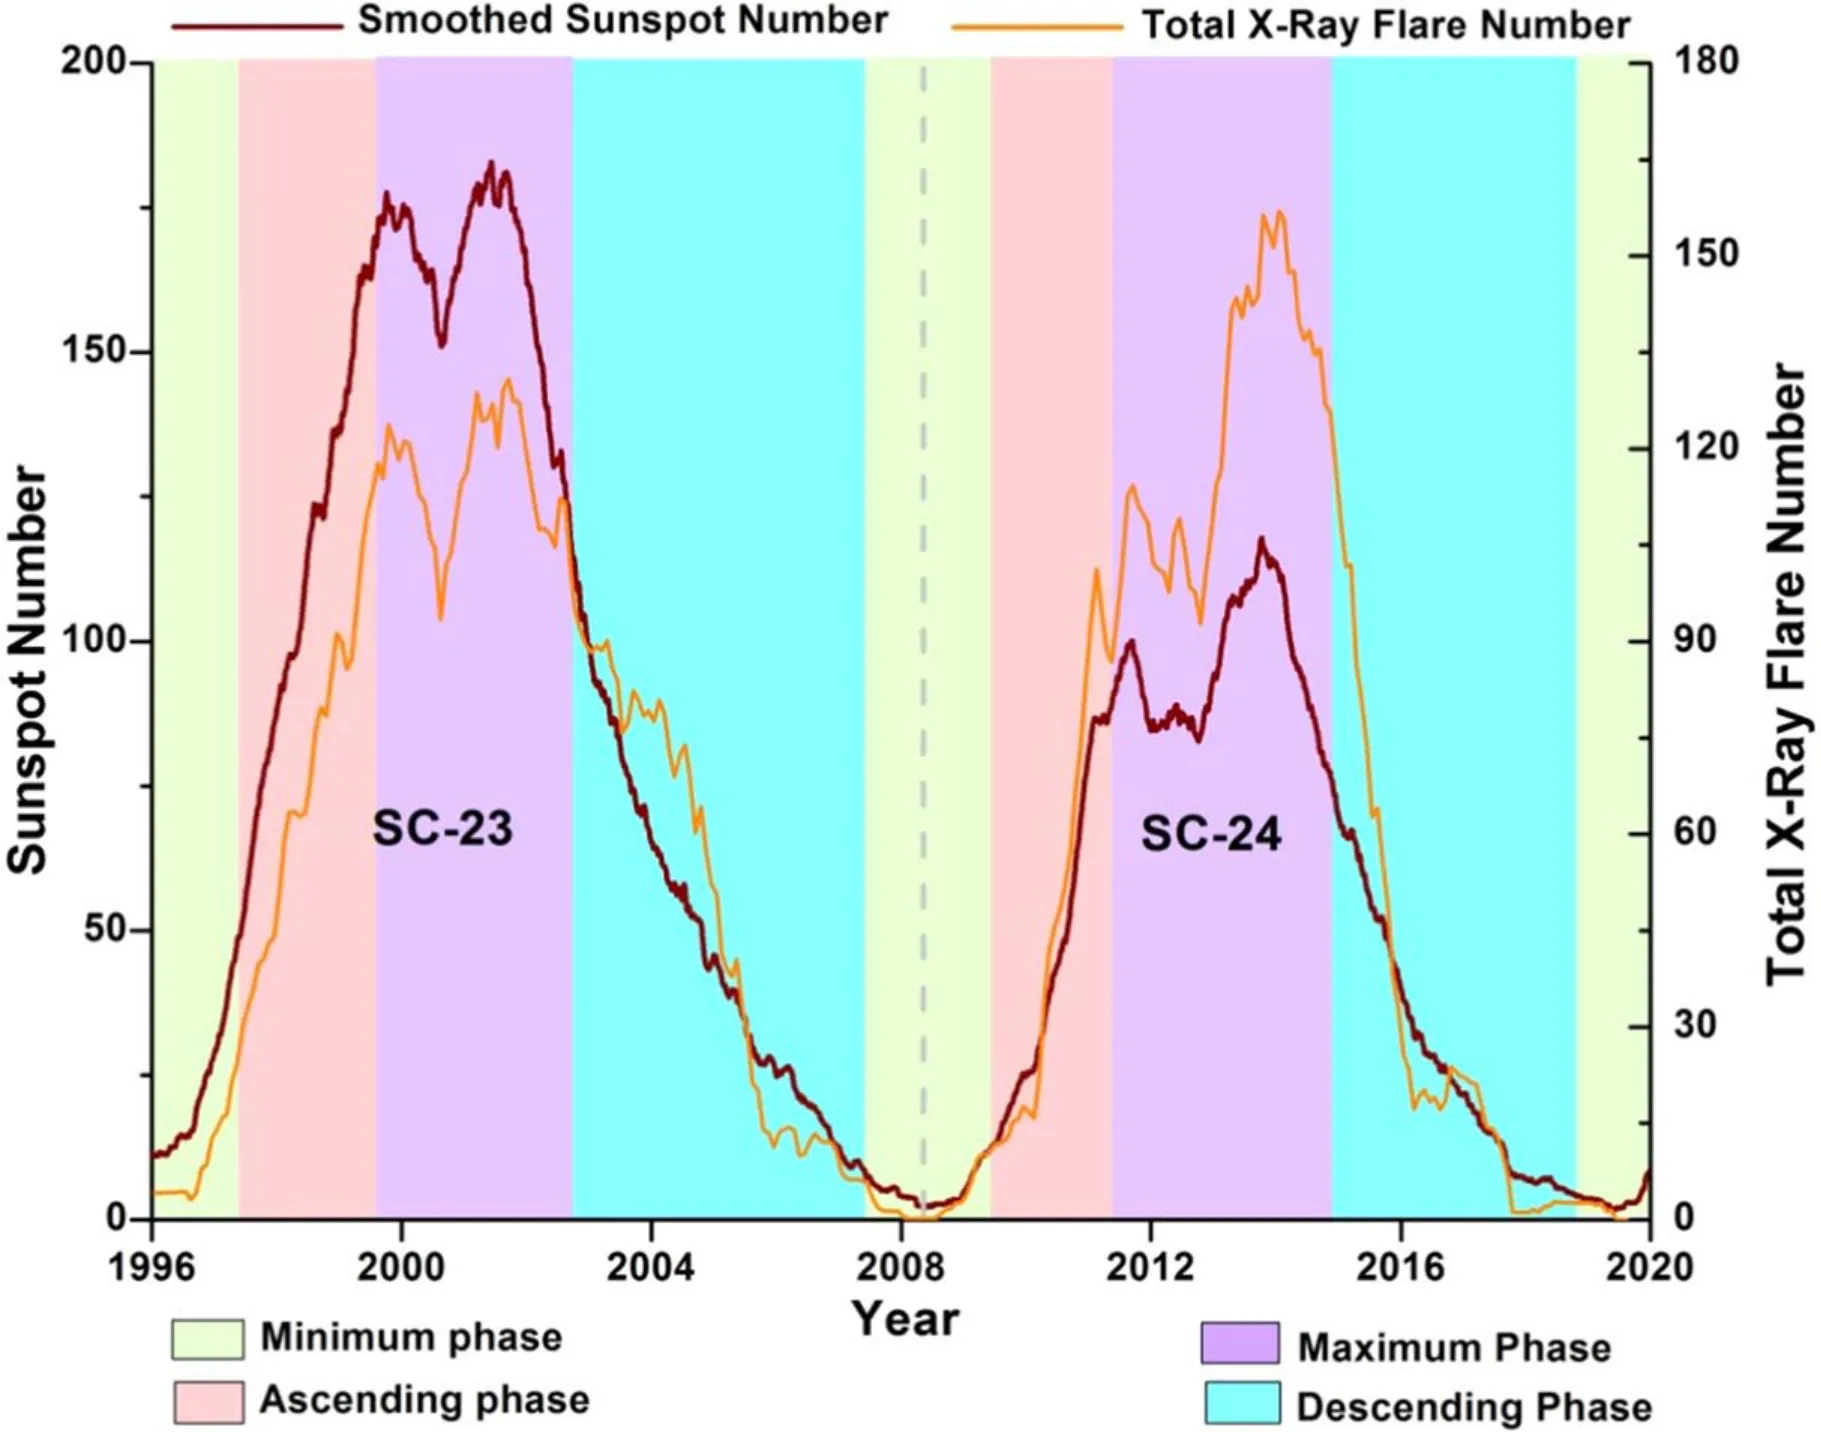
Figure 1.Yearly moving averaged daily SSNs and monthly moving average of total X-ray flare number.
Here we studied various types of the Sun’s ARs,considering seven kinds of SSGs (A, B, C, D, E, F and H) by McIntosh’s classification, regarding the variation of occurrence and flaring potential during SC-23 and 24.The data for these SSGs were obtained from the Heliophysics Integrated Observatory(HELIO) website (http://voparis-helio.obspm.fr/hec/hec_gui.php) by selecting the solar AR summary of NOAA/USAF for the period 1996–2019 which covers SC-23 and 24.From the same website of HELIO, we also obtained the data for soft X-ray solar flares provided by the Geostationary Operational Environmental Satellite (GOES) of NASA from 1996 to 2019(SC-23 and 24).Here we have considered only C, M and X-class flares and neglected A and B class flares.For analyzing daily data on the total number of flares and related SSGs during SC-23 and 24, we matched data sets of solar ARs and emitted flares by considering only those flares associated with a specified AR.We studied the variation of total solar flare number (C+M+X) with various stages from SC-23 and 24.We have chosen the daily SSN as an indicator of solar activity because it has been considered the best indicator of solar activity.The SSN data were acquired from the website of Sunspot Index and Long–term Solar Observations (SILSO,https://www.sidc.be/SILSO/datafiles).To find different threshold values for SCs, we computed the smoothed SSN as follows: first, we took a 365 day moving average and then defined the time duration between two successive minimum values as an SC.Now we separate different phases by using the same convention as by Hynönen (2013) and Kilpua et al.(2015).We first calculate the mean value of the smoothed SSN and standard deviation (SD) between minimum value and subsequent maximum, and define ascending phase as the duration in which smoothed SSN values stand between the mean SSN value ±1SD.To determine the descending phase,we calculated the mean value of the smoothed daily sunspot number (DSSN) and SD between the maximum value and the subsequent minimum value and defined the descending phase as the time duration in which the smoothed SSN lies between the smoothed meanDSSN 1SD.We define the maximum phase as the duration between the ascending and descending phases of a given SC, and the minimum phase as the time between descending and ascending phases of two successive cycles.We plotted total counts of flares(C,M,and X-class)in each month observed between the years 1996–2019 to know their variation during different phases of an SC.We plotted flaring potential values of different class SSGs each year from 1996 to 2019 to ascertain their variation during different stages of SC-23 and 24.We also plotted the percentage of different SSG classes and their flaring potential during both SCs (23 and 24).
4.Results and Discussion
Data on daily SSNs from 1996 January to 2019 December(SC-23 and 24) were smoothed using the 365 day SG smoothing method, and the associated plot is shown in Figure 1 by a brown curve.The gray dotted vertical line separates two SCs (23 and 24).From the brown curve, it is obvious that variations in sunspots during each cycle have double peaks, of which the first peak is lower than the second peak.The highest peak of SC-24 is lower than the peak of SC-23, which means solar activity during SC-24 (maximum SSN 110, whose duration was 11 yr from 2009 to 2019) was lower than during SC-23 (maximum SSN 180, whose duration was 13 yr from 1996 to 2008).In SC-24, the change between the first and second peaks is bigger than that in SC-23, which shows that solar activity increased very much during the second peak in SC-24 in comparison to SC-23.
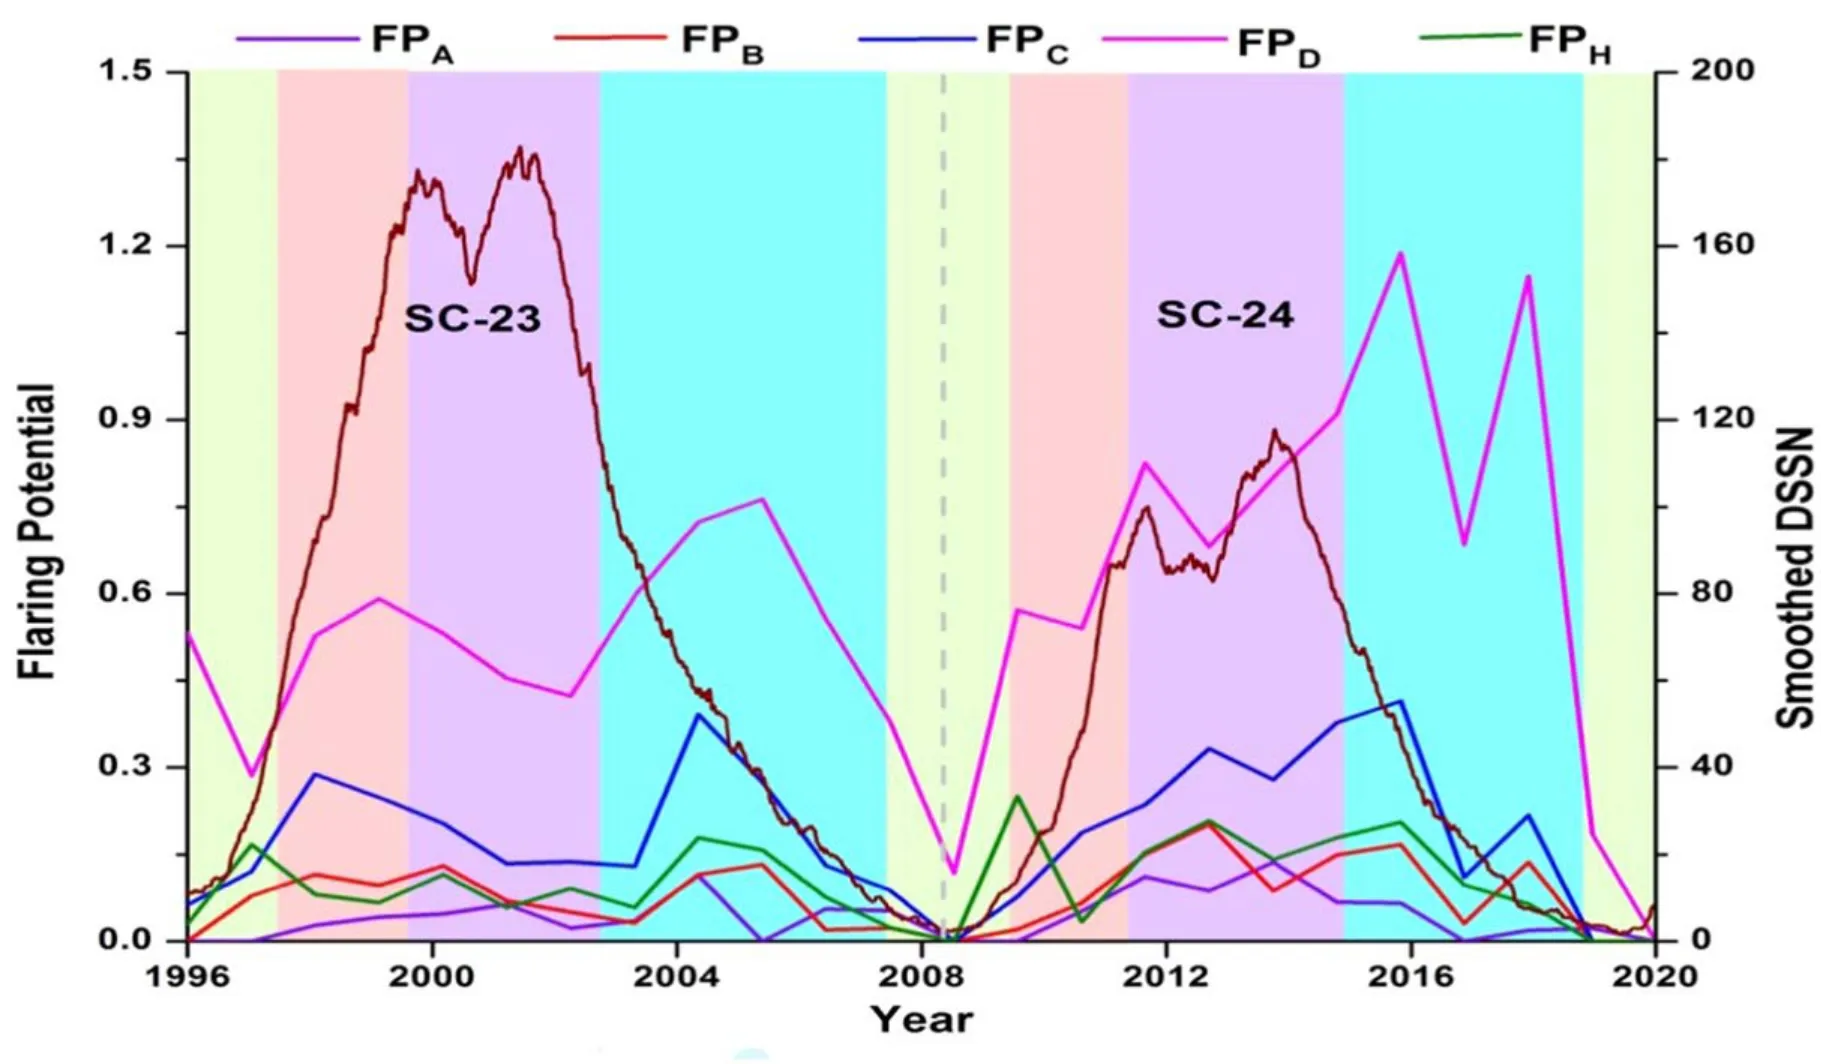
Figure 2.Yearly variation of flaring potential during SC-23 and 24 from A, B, C, D, and H class SSGs.
We studied the variations in the production of total soft X-ray solar flares (C, M, and X-class together) by the Sun during SC-23 and 24.We counted all the flares that originated every month from 1996 to 2019, covering SC-23 and 24.We employed 12 months of SG smoothing for the total flares (C+M+X-class) produced each month from 1996 to 2019 in order to observe variation during different phases of SC-23 and 24, indicated by the orange curve in Figure 1.From this, we can analyze the variation in the number of X-ray flares (C, M,and X-class) produced along with variations in SSNs during different stages of SCs (23 and 24).By analyzing the orange curve in Figure 1, it is obvious that a number of flares that emerged from the Sun also have two peaks, like displayed for SSNs, during both SCs.However, it is very interesting and noticeable that even SC-24 is a weak SC in comparison to its previous SCs, and the peaks of the total smoothed number of flares produced each month in SC-24 are greater than the peaks in SC-23 while SC-24 was a weak cycle regarding solar activity as SSNs were much less in SC-24; Nandy (2021) also reported that in the past century SC-24 was the weakest cycle,but the Sun produced more flares during the months of maximum phase in SC-24 than in the previous SC-23.Joshi&Joshi(2004)also reported a lower level of solar activity during SC-23 regarding soft X-ray flare events by computing soft“Xray flare index (FISXR).”
We can see that there is a sharp increase during the ascending phase and a sharp decrease during the descending phase in the number of flares that emerged from the Sun in SC-24, but in SC-23, there was a gradual increase during the ascending phase and a gradual decrease during the descending phase in the number of flares produced.Feldman et al.(1997)also found that flare activity increases during the maximum phase of an SC because of the stable heating of the corona.It is crucial to study the special nature shown by SC-24, which is completely different from previous cycles.During the minimum phase between two cycles in 2008, the soft X-ray flares(C, M, and X-class) produced by the Sun are negligible in count.It will be clearer if we do the same study for earlier SCs.
We studied the flaring potential of each SSG(A,B,C,D,E,F,and H)during SC-23 and 24.Based on the maximum flaring potential during SC-23 and 24,we grouped the different classes of solar ARs into two,of which the first has A,B,C,D,and H class regions, having a maximum flaring potential of nearly 1.2 flares per AR,as shown in Figure 2,and the second,E and F-class solar ARs, having a maximum flaring potential higher than 1.2 flares per AR,as shown in Figure 3.From Figure 2,it is obvious that SSGs (A, B, C, D, and H) have different ways of varying flaring potential during the ascending, maximum,and descending phases of SC-23 and 24.Flaring potential is higher in ascending and descending phases than in the maximum phase during SC-23.Their variation exhibits an oscillatory nature from ascending to the descending phase of SC-23.In SC-24 they do not display an oscillatory nature.Their flaring potential increases continuously from the lowest value in the minimum phase to their highest value in the descending phase of SC-24 and after that decreases.In both SCs(23 and 24),the potential to generate flares of the SSGs(A,B, C, and H) decreases to their minimum value, nearly zero,except for D class,whose flaring potential never becomes zero.All SSGs show variations in the same way in SC-23 and 24 separately.The peak flaring potential of SSGs A,B,C,D,and H in SC-24 is higher than their peak value in SC-23.The D-class SSGs have a flaring potential two or more times greater than that of the A, B, C, and H-class SSGs.
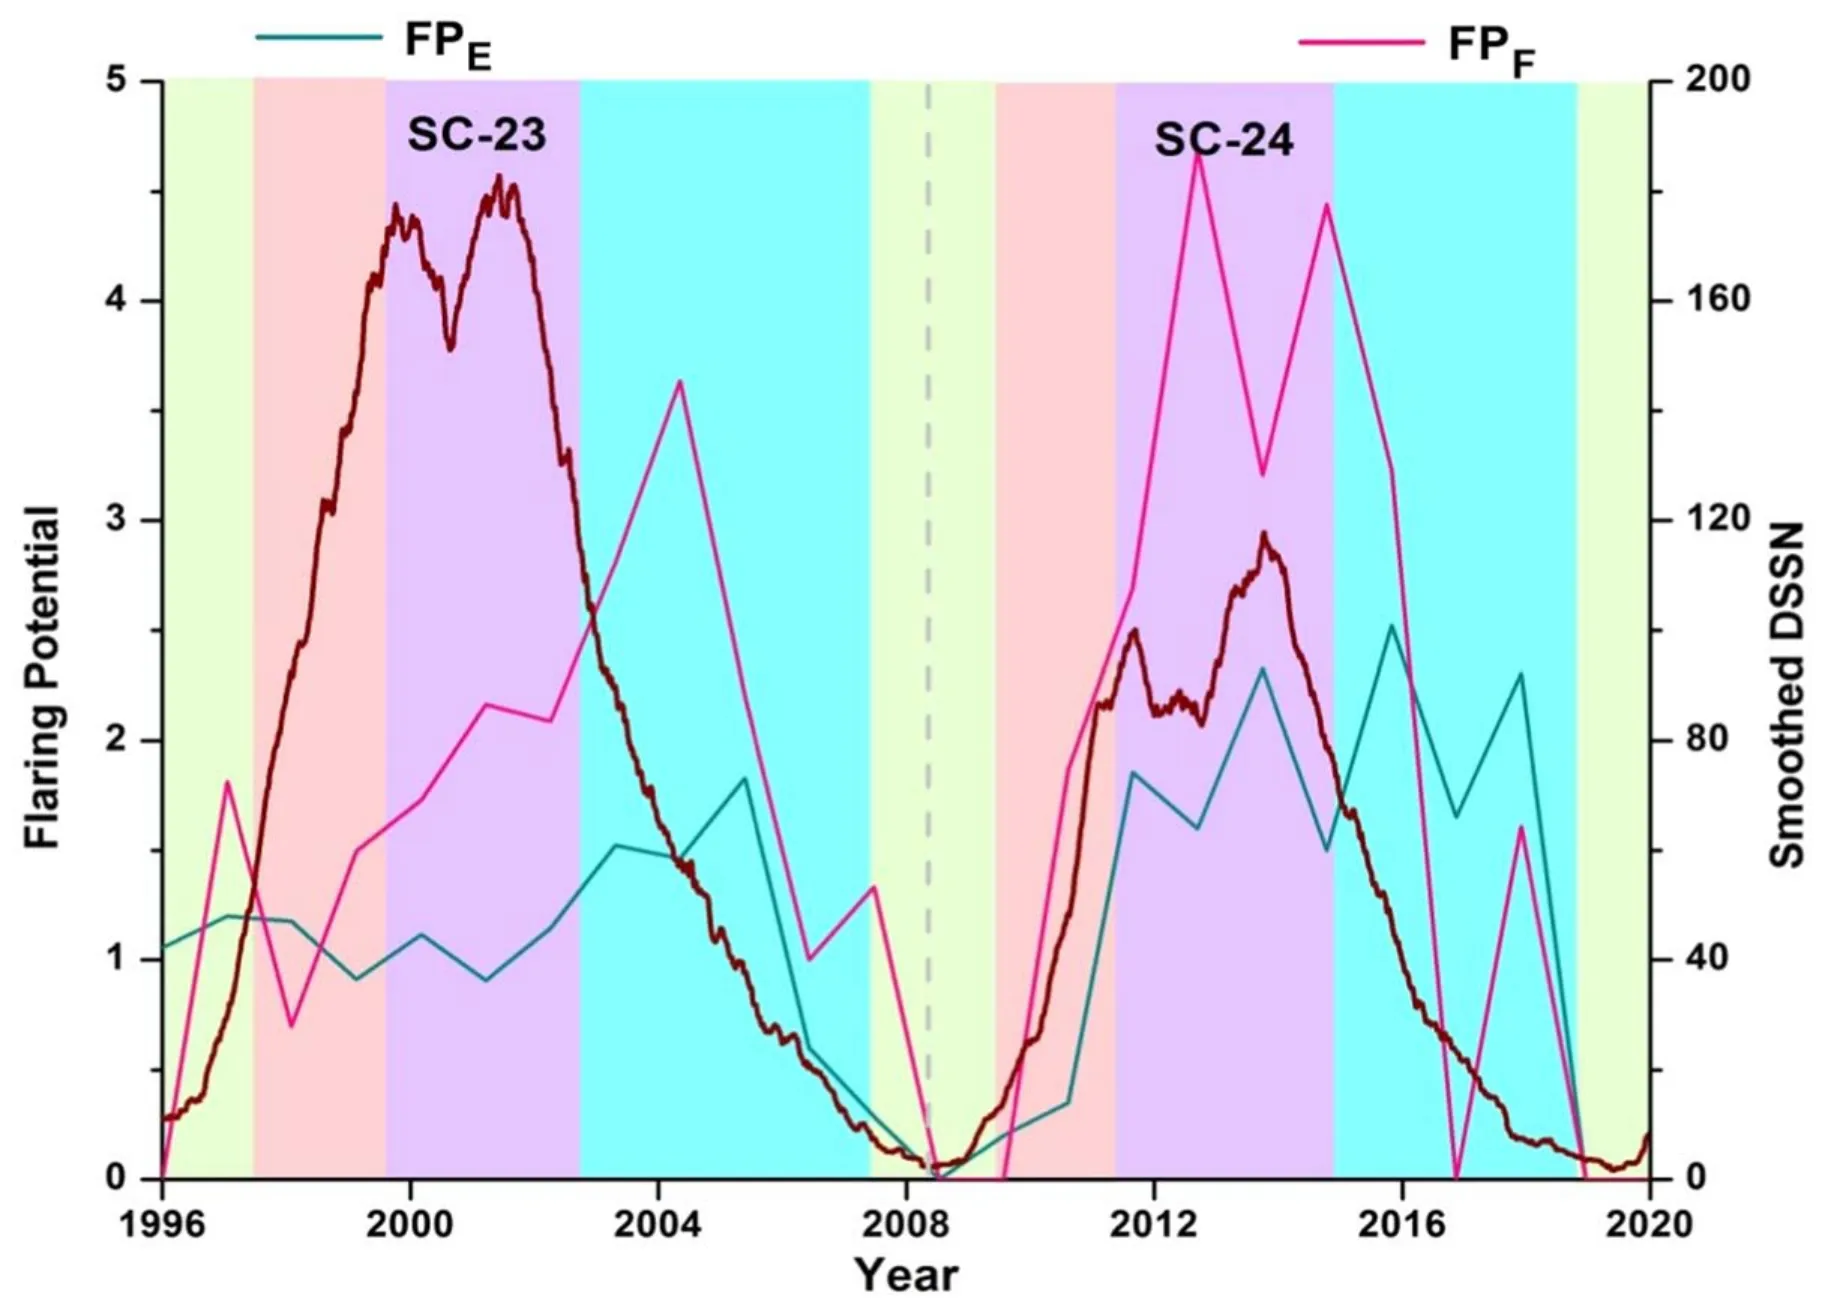
Figure 3.Yearly variation of flaring potential during SC-23 and 24 from E and F class SSGs.
The variation in the potential to generate flares of E and F class SSGs is depicted in Figure 3.From this,it is obvious that the flaring potential of both SSGs E and F changes in the same fashion during both SCs(23 and 24).During SC-23,the flaring potential increases gradually from its minimum in the ascending phase to its maximum in the descending phase,after which it decreases continuously to its lowest value in the minimum phase between cycles 23 and 24.In SC-24, flaring potential of E and F class SSGs begins to increase from their lowest value in the minimum phase to the highest value of ˜2.4 and ˜5.7 respectively in the descending phase for the E-class and maximum phase for F-class SSGs,and after that decreases.It is obvious that the highest flaring potential of the SSG of F-class is nearly twice that of the E-class SSGs.In SC-23,their flaring potential was highest in the descending phase while in SC-24 it was highest in the maximum phase for F-class and descending phase for E-class SSGs.It is noticeable that the F-class SSGs were very active in the maximum phase of SC-24(a weak SC).
From the above discussion, it is clear that the flaring potential of F-class SSGs is highest in both SCs (23 and 24),but its variation is different from the variation of the rest of the six classes of SSGs.SSGs of A-class produce minimum flares as their highest flaring potential value is nearly 0.12 and 0.13 in SC-23 and 24, respectively.The A, B, C, D, E, and H SSGs have nearly the same pattern of variation in flaring potential but are distinct in SC-23 and 24.It is very interesting that the flaring potential of all SSGs reaches its highest value through the descending phase of both SC-23 and 24 except for F-class SSGs in SC-24.So, it is obvious that the production of geoeffective flares (C, M, and X-class) in the SCʼs descending phase reaches its highest value, generally.On the basis of the maximum value of flaring potential, we can split the seven SSGs into two, of which the first has A, B, C, and H-class groups and the second has D, E, and F-class groups.The highest flaring potential of the second group is 3–10 times larger than that of the first group.Eren et al.(Eren 2017) also grouped different McIntosh-classified SSGs into two groups:the first D,E,and F and the second A,B,C,and H groups.The flaring potential of the first group is 8 times greater than that of the second group.The first group has large and complex types of SSGs, and the second has small and simple types of SSGs.
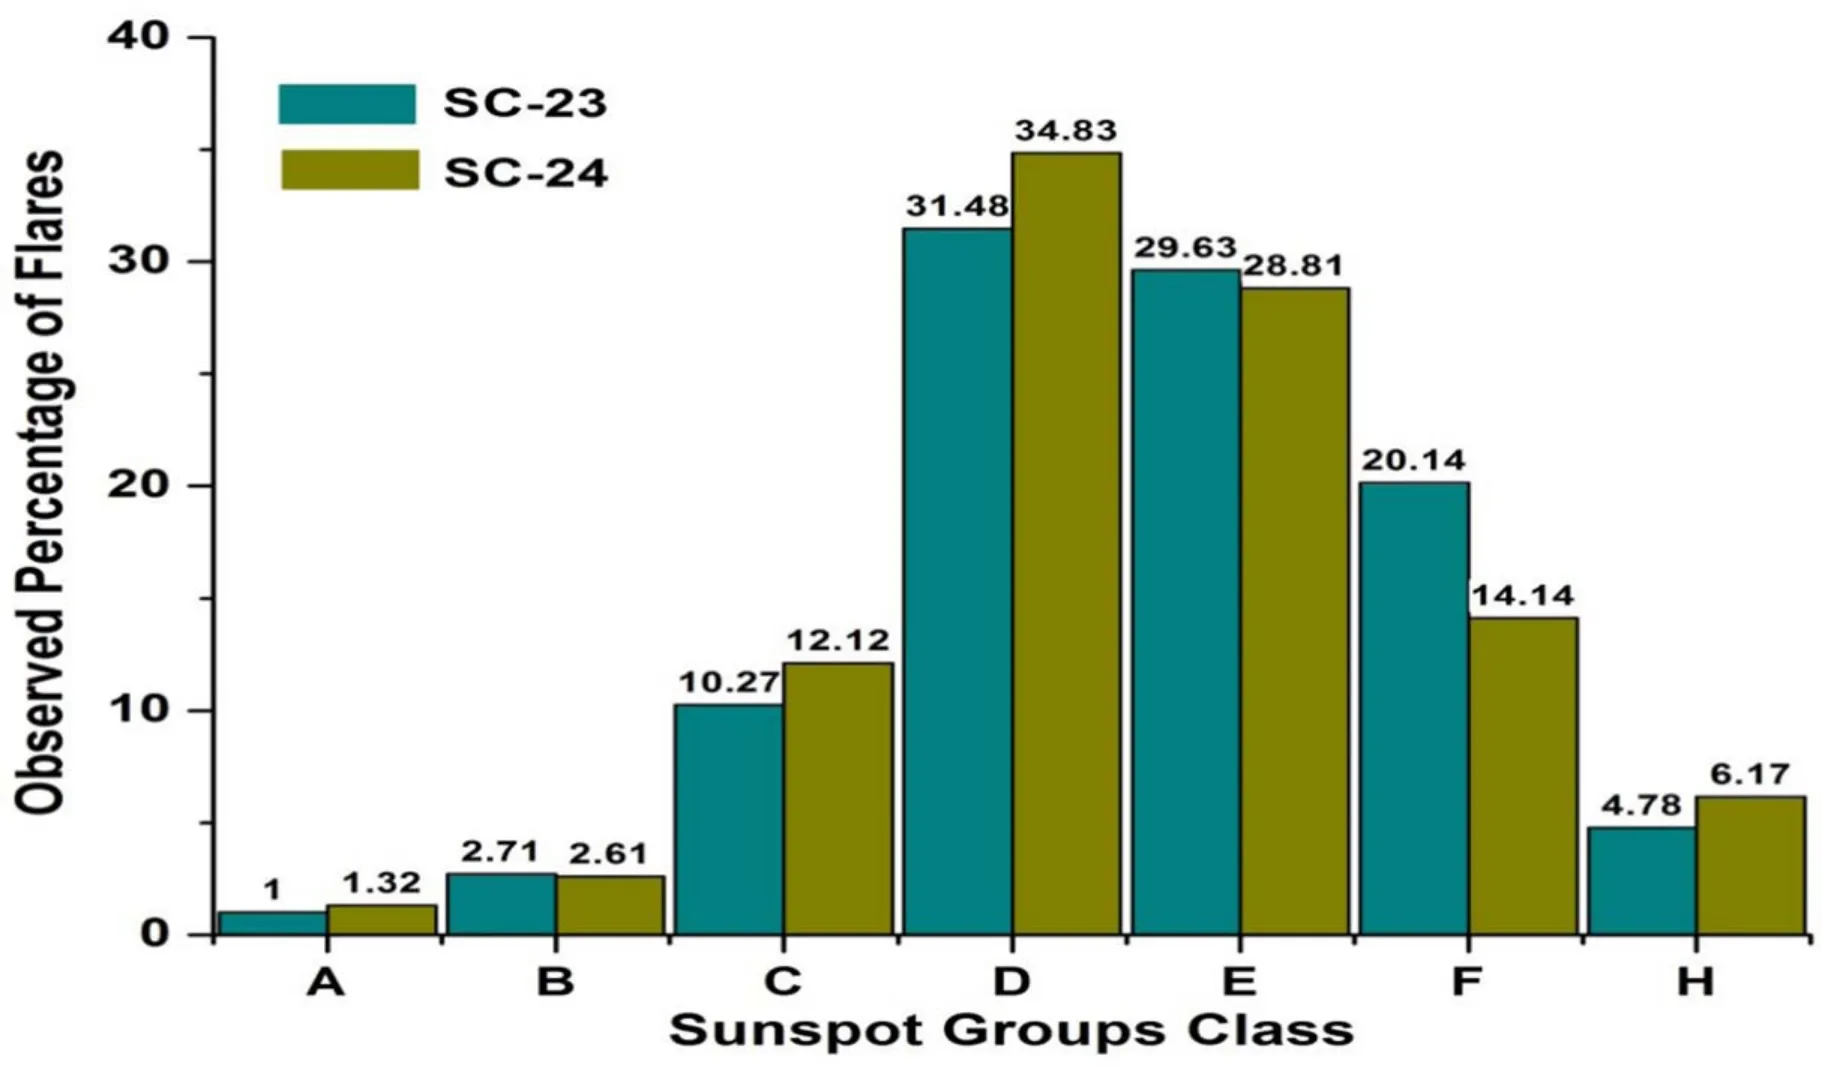
Figure 4.Percentage of the observed number of flares from different SSG groups during SC-23 and 24.
Now we investigate the percentage of flares originating from different SSG classes during SC-23 and 24 separately, with a graphical representation in Figure 4.It is obvious that there is approximately the same pattern of flares produced from different classes of SSG during SC-23 and 24.The SSGs of D-class are producing the highest number and percentage of flares(31.48%and 34.83%in SC-23 and 24,respectively).The SSGs of A-class are producing minimum (1.0% and 1.32% in SC-23 and 24,respectively)flares.Combined,D,E,and F class SSGs produce more than 80%of flares,and the other A,B,C,and H class SSGs produce merely 20%of flares.If we arrange the various SSGs in increasing order of the percentage of flares produced by them, we get the series A, B, H, C, F, E, and D during both cycles 23 and 24.Eren et al.(Eren 2017) also reported the same results.Earlier studies also showed a consistent result of ARs that are morphologically complex producing more flares (Atac 1987; Gallagher et al.2002;Ternullo et al.2006; Norquist 2011; Lee et al.2012;McCloskey et al.2016), and the same was observed in our study.The percentage of flares originating from D-class SSGs increased by 3%, and flares originating from F-class SSGs decreased by 6%in SC-24 in comparison to SC-23.The change in the percentage of flares generated from the other A, B, C,and H SSGs is negligible from SC-23 to SC-24.In SC-24, the F-class sunspots,which are the largest and most complex,were less active in comparison to those in SC-23.
We examined the flare production potential of various SSGs during the years 1996–2008 and 2009–2019, covering SC-23 and 24, respectively, as shown in Figure 5 and its data in Table 3.From Figure 5, it is obvious that the potential of flare production of all SSGs was high in SC-24 in comparison to SC-23,while SC-24 was considered a weak SC in comparison to SC-23.The rise in flaring potential of F-class SSGs among all SSGs is higher in SC-24 than in SC-23.The flaring potential of SSGs A to F in Figure 5 shows an exponential pattern(Eren et al.2017).The flaring potential of A-class SSGs is the lowest and that of F-class ones is the highest among all SSGs.Interestingly, even SC-24 was a weaker SC, but the flaring potential of all SSGs was high in comparison to SC-23.We can say that the increment in flaring potential of the smallest and simplest SSG“A”is the lowest and that of the largest and most complex SSG“F”is the highest in SC-24,compared to SC-23.
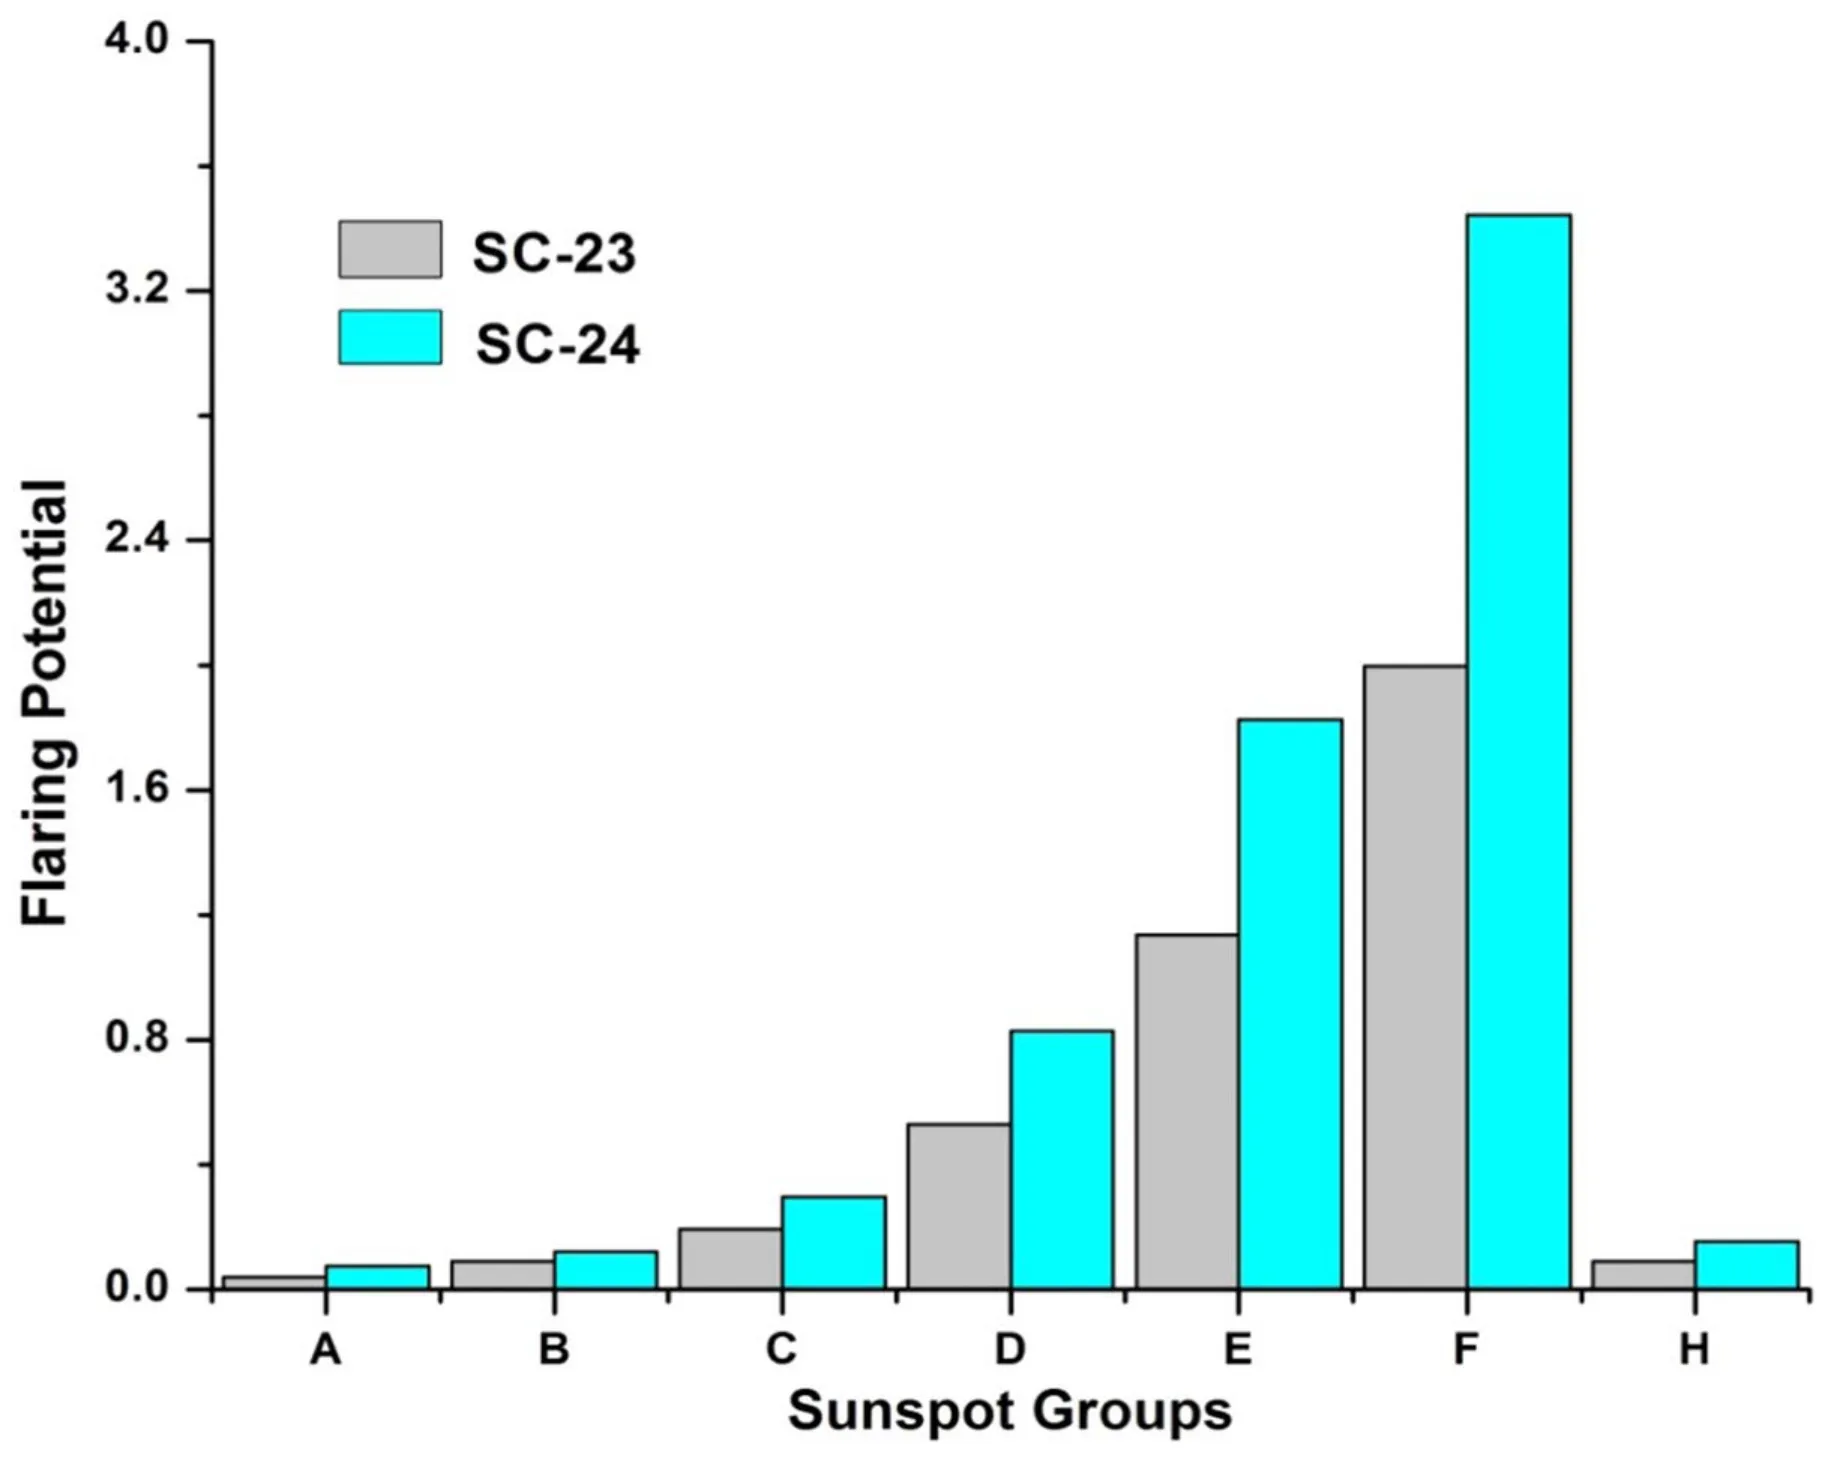
Figure 5.The flaring potential of different SSGs producing flares during SC-23 and 24.
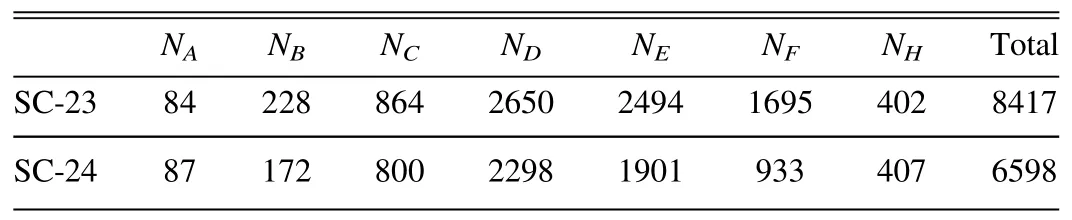
Table 1 Number of Flares Originating from Different Classes of SSGs
The statistical results for each SSG are listed below in Tables 1,2,and 3.In Table 1,NA,NB,NC,ND,NE,NF,and NHare the number of flares produced from A, B, C, D, E, F, and H-class SSGs, respectively.The quantity of flares from B, E,and F-class SSGs has decreased very much in SC-24 in comparison to their number in SC-23.The number of SSGs of different categories counted in SC-23 and 24 is listed in Table 2.The number of F-class SSGs in SC-24 is nearly onethird that of SC-23.It is obvious from Table 3 that the flaring potential of the D-class group is four times lower than that of the F-class group.The increase in flaring potential of SSGs of various categories in SC-24 from their corresponding values in SC-23 for F-class groups is twice that of E-class groups and three times that of D-class groups.
This study confirms that we can predict the mid-term of the Sun’s flaring activity by using modified Zurich (McIntosh)class SSGs.We see that nearly 81.25% and 77.78% of flareswere produced by D, E, and F SSGs combined in both SC-23 and 24, respectively.Kilcik et al.(2011) already ascertained that the number of SSGs of D, E, and F-classes is very well correlated with various solar and geomagnetic activities than international SSNs while SSGs of A, B, C, and H-classes do not correlate well.From these results, we conclude that D, E,and F-class sunspot regions produce maximum events that are geo-effective.Based on a long time series study we observed that D,E,and F-class ARs contribute about 37%in SC-23 and 33.95% in SC-24 among all ARs producing flares.Hudson et al.(2014) analyzed the solar flare productivity from various individual solar ARs for four SCs.They found that the complex natures of the magnetic fields of solar ARs play a vital part in generating flares in comparison to their size.Aulanier et al.(2013)found that nearly 30% of the ARs with a very complex structured and highly concentrated magnetic field produce solar flares.This implies that AR magnetic field complexity and flare production are linked together; hence, we claim that the complexity of the magnetic field of ARs and their flaring potential are associated in a direct manner.Again in 2013,Aulanier et al.(2013) and Shibata et al.(2013) found,theoretically, that the solar AR’s magnetic field complexity and production potential of a flare are connected to each other.In accordance with Shibata et al.(2013), a superflare with an energy of around 1034erg can be produced by an AR with ˜1023Weber magnetic flux, which is one order of magnitude higher than a bigger solar AR.Even an AR with a larger area,as stated by Aulanier et al.(2013), has a greater likelihood of releasing solar flares,but these flares are not expected to have much more energy than the strongest solar flare that has been documented,which had an energy of 1032erg.
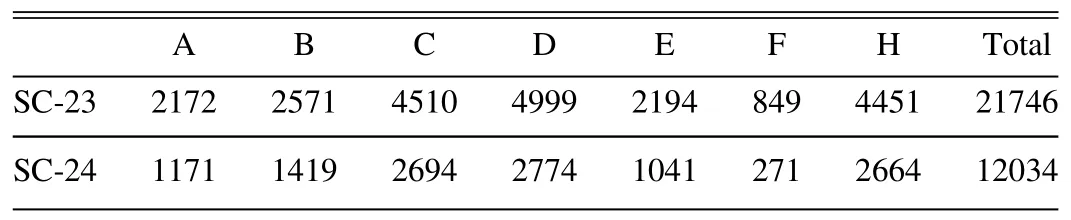
Table 2 Total Number of various Classes of SSGs that Occurred During SC-23 and 24
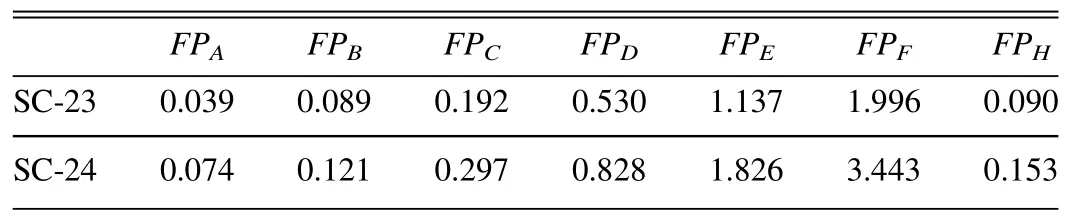
Table 3 Flaring Potentials of Different SSGs in SC-23 to SC-24
5.Summary and Conclusions
In this study, we took the DSSN and smoothed it for a 365 day average and determined the different phases of the cycle, and also separated two cycles by a dotted demarcation line.Now we used these different phases of both cycles in our further study.We restricted our study to SC-23 and 24 from the year 1996 to 2019.In this, we considered only C, M, and X-class solar flares because these are geo-effective flares.We excluded A and B-class flares as they do not affect Earthʼs environment.We considered the McIntosh classified SSGs (A,B, C, D, E, F, and H) as the originator of solar flares and neglected their other sources.We neglected the flares which are not correlated with any sunspot region.The total number of flares originating from an SSG divided by the total number of SSGs (same-class) observed in a year/month/cycle is known as the yearly/monthly/SC flare production potential.In this study, we examined a variation of the yearly and SC’s flare production potential of different SSGs during SC-23 and 24.
1.SC-24 has been observed to be weaker than the 23rd SC on the basis of the peak value of SSN being less in comparison to that in its previous SC, and it has already been stated that SC-24 is the weakest SC of the last century (Nandy 2021).The duration of SC-23 was 13 yr from 1996 to 2008, while for SC-24 it was 11 yr from 2009 to 2019.The number of SSGs and solar flares show double peaks in the same manner in SC-23 and 24.The variation in the total number of flares(C,M,and X-class together)during SC-23 and 24,from 1996 to 2019,shows that it also has the same period of variation as the sunspot cycle.The fact that a weaker SC-24 has a higher number of flares during each month of maximum phase than a stronger SC-23, which was observed to be stronger, is quite intriguing and incongruous.SC-24 needs to be studied in detail in order to gain more knowledge on the solar process.
2.In this work, we examined the variance in flaring potential for different Zurich class SSGs during all phases of SCs-23 and 24 for the first time.We revealed that the maximal flaring potential of the vast and complex D,E,and F-class sunspot areas is three to ten times more than that of the tiny and simple A, B, C, and H-class sunspot regions.The strongest flaring potential is seen in the F-class SSGs, and the change in flaring potential is greatest during SC-23 and SC-24; in contrast, A-class SSGs have the lowest flaring potential and the least amount of change in that potential.With the exception of F-class SSGs, which have the highest flaring potential during SC-24ʼs maximum phase, all SSGs have their highest flaring potential during the descending phase of SC-23 and 24.This leads us to the conclusion that the Sun produces more flares per SSG during the SC’s descending phase.The most complicated SSG “F” was extremely active in SC-24ʼs maximum phase.If we combine C, M, and X-class soft X-ray flares with A and B-class flares, the findings can be different.
3.The flaring pattern of the Sun during SC-24 was much different than that during SC-23, as there was much flaring activity during the maximum phase of SC-24 while in SC-23 it was highest during ascending and descending phases.The peak of the flaring potential level of different A to F SSGs in Figure 5 shows an exponentially increasing pattern of flaring potential(Eren et al.2017).In SC-24,the Sun’s flare output ascends very sharply from the ascending to the maximum phase and then drops off very sharply from the maximum to the descending phase.While during SC-23, the Sun’s flare production gradually increased and decreased.
4.We counted a total of 8417 flares and 21746 SSGs in SC-23 while 6598 flares and 12034 SSGs in SC-24.Our study reveals that the total number of flares produced in SC-23 is higher than in SC-24.
5.The year 2019 marked the end of SC-24 because the solar activity reached its minimal level.This year any soft X-ray flares of either C,M or X class associated with the Earth facing the portion of the Sun could not observed.
Acknowledgments
The work is partially supported by the Institute of Eminence(IoE) Program (Scheme No: 6031) of BHU, Varanasi.
ORCID iDs
A.K.Singh https://orcid.org/0000-0002-8834-2464
 Research in Astronomy and Astrophysics2024年2期
- Research in Astronomy and Astrophysics的其它文章
- A Fermi-LAT Study of Globular Cluster Dynamical Evolution in the Milky Way: Millisecond Pulsars as the Probe
- Application of Regularization Methods in the Sky Map Reconstruction of the Tianlai Cylinder Pathfinder Array
- Effect of Cosmic Plasma on the Observation of Supernovae Ia
- Variable Stars in the 50BiN Open Cluster Survey.III.NGC 884
- Free Energy of Anisotropic Strangeon Stars
- Data-driven Simulations of Magnetic Field Evolution in Active Region 11429:Magneto-frictional Method Using PENCIL CODE