
Mortality characteristics during the two waves of COVID-19 in India: A retrospective observational study
2022-04-12 10:54NaliniRameshHumaneyShilpaSachinKutheShamimAkhtarVivekPande
Journal of Acute Disease 2022年2期
Nalini Ramesh Humaney, Shilpa Sachin Kuthe, Shamim Akhtar, Vivek K Pande
Department of Medicine, Nkpsims and Lata Mangeshkar Hospital, Nagpur, India
ABSTRACT Objective: To evaluate patient demographic characteristics and risk factors for mortality during the first and the second wave among COVID-19 patients in a tertiary care hospital of India.Methods: Data were taken from the hospital’s electronic system for COVID-19 patients from August 2020 to December 2020, and the second from January 2021 to May 2021.The mortality rate, demographic and clinical characteristics, laboratory profile, and reasons for the death of the two waves were retrieved and compared, and the risk factors of the two waves were determined.Results: In the first wave, 1 177 COVID-19 cases visited the hospital and 96 (8.2%) died.In comparison, the death rate in the second wave was significantly higher (244/2 038, 12.0%) (P<0.001).No significant difference in age [60 (50-69) vs.60.5 (53-70), P=0.11] or gender (P=0.34) was observed between the two waves.Compared to the first wave.there were significantly more cases with fever, cough, weakness, loss of taste and smell, and sore throat during the second wave (P<0.05), but significantly fewer cases with kidney disease (6.6% vs.13.5%, P=0.038) and diabetes mellitus (35.7% vs.50.0%, P=0.015).Besides, during the second wave, more patients had abnormal X-ray findings, higher levels of lymphocytes and serum ferritin (P<0.05).In addition, there were significant differences in the rate of death cases with acidosis, septic shock, acute kidney injury, diabetes mellitus, cardiovascular events, hypothyroidism (P<0.05).Multivariate regression showed that during the first wave, age (OR: 1.10; 95% CI: 1.02-1.21), diabetes mellitus (OR: 3.16; 95% CI: 2.08-3.53), and abnormal X-ray (2.67; 95% CI: 2.32-2.87) were significant independent risk factors of mortality; while in the second wave, age (OR: 1.13; 95% CI: 1.12-1.28), diabetes mellitus (OR: 8.98; 95% CI: 1.79-45.67), abnormal X-ray (OR: 12.83; 95% CI: 2.32-54.76), high D-dimer (OR: 10.89; 95% CI: 1.56-134.53), and high IL-6 (OR: 7.89; 95% CI: 1.18-47.82) were significant independent risk factors of mortality .Conclusion: Overall mortality and incidence of severe diseases are higher in the second wave than the first wave.Demographic characteristics, co-morbidities, and laboratory inflammatory parameters, especially D-dimer and IL-6, are significant risk facors of mortality during the COVID-19 pandemic.
KEYWORDS: SARS-COV-2; COVID-19; Second wave; First wave; Pandemic
1.Introduction

Coronavirus disease-19 (COVID-19), caused by the severe acute respiratory syndrome coronavirus 2 (SARS-CoV-2), has emerged as a pandemic, posing a substantial health risk worldwide.A two-wave pattern of reported cases has been observed in many countries; the first wave occurred in the spring and the second wave occurred in the late summer and autumn of 2020[1-4].
The first outbreak of COVID-19 cases in India started in early March 2020, even though isolated cases were reported in February.Due to the first outbreak, the Indian government implemented severe prophylactic measures, including nationwide lockdown from March 13th to May 4th, 2020, followed by three months of gradually increasing social interaction, work, and commercial activities, which prevented the early first wave.
Life in the country returned to relatively normal as of July 2020, except for the necessary wearing of face masks and ensuring safe social distancing.The first wave thereafter erupted with a peak in September 2020, followed by a second wave peak in March 2021, with different parts of the country experiencing varying stages of the outbreak[5].
As a result, the government was compelled to reinstate severe restrictions, comprising local and regional lockdowns, closures of hotels, restaurants, cultural and sports events, and a general curfew at night in containment areas.The number of cases in India stabilized since then, with some ups and downs.
Most of the parts of India are presently experiencing the impact of second-wave and are implementing restrictive measures.However, empirical evidence suggests that this second wave is different from the first wave in terms of age range and disease severity[6].
The second wave of COVID-19 in India may be associated with the emergence of a novel variant of the SARS-CoV-2, named as delta variant of the B.1.617.2 strain, which seems to be spreading through tourists who had spent their summer holidays worldwide[7].
The similarities and differences between the characteristics of the two waves remain largely unknown[7].However, it is possible to compare the two waves through the analysis of hospitalized patients whose disease was diagnosed by “reverse transcriptionpolymerase chain reaction (RT-PCR)” and who had severe symptoms[8].
The present study aimed at comparing the mortality as well as demographic characteristics, symptoms, comorbidities, clinical and laboratory profile, causes of death of the first wave and the second wave, and to find out the risk factors of the two waves.
2.Patients and methods
2.1.Study design
We conducted a retrospective observational study on hospitalized cases of SARS-CoV-2 infection in a tertiary care hospital at Nagpur, India, who were admitted between August 2020 and December 2020 (the first wave), January and May 2021 (the second wave).
2.2.Ethical consideration
The approval for conducting the study was taken from the Institutional Ethical Committee (NKPSIMS & RC and LMH/IEC/24/2021, dated 03rd September 2021).
2.3.Inclusion and exclusion criteria
The hospitalized patients having a diagnosis of SARS-CoV-2 and clinical severity of Group E and F (moderate to severe disease) were included.Exclusion criteria included patients with suspected SARSCoV-2 infection but without laboratory confirmation and those who presented to the hospital with symptoms consistent with COVID-19 but in whom hospitalization was not required.
2.4.Diagnosis
RT-PCR test was used to confirm SARS-CoV-2 infection; swab samples were taken from the lower respiratory tract (sputum/endotracheal aspirate/bronchoalveolar lavage/bronchial aspirate), upper respiratory tract (nasopharyngeal/oropharyngeal exudate), or lower digestive tract (rectal smear).The patients were categorized into different groups (Group E and F) of COVID-19 severity.Group E (StageⅡ-Moderate) included the patients of pulmonary involvement in the form of pneumonia/lower respiratory tract infection, with respiratory failure (SpO2<94% on room air, respiratory rate>24/min, PaO2<60) thereby requiring oxygen therapy.Group F (Stage Ⅲ-Critical) included the patients of pulmonary involvement in the form of pneumonia/lower respiratory tract infection with respiratory failure (SpO2<90% on room air, Respiratory Rate>30/min, PaO2<60) with sepsis/septic shock/multiorgan dysfunction syndrome.
2.5.Sample size
The study of Iftimie et al.[2] observed that the mortality rate in the first wave was 24.0% and the second wave was 13.2%.Taking these values as a reference, the minimum required sample size with 99% power of study and 1% level of significance is 614 patients in each study group.To reduce the margin of error, the total sample size taken is 3 215 (1 117 in the first wave and 2 038 in the second wave).
2.6.Data collection
The records of the patients related to the demographic characteristics (age, gender, co-morbidities) and clinical features during hospitalization due to COVID-19 in both waves were retrieved.Out of the total hospitalizations, total mortality rates were evaluated.Further, the data related to admissions and hospital stays were noted and compared.Vitals comprising of temperature (℃), respiratory rate (per minute), pulse rate (per minute), blood pressure (mmHg), SpO2in % on room air, chest X-ray findings and the routine blood investigations such as hemoglobin (g/dL), total leucocyte count (TLC, cells/mm), differential leucocyte counts, lactate dehydrogenase (U/L), C-reactive protein (CRP, mg/L), D-dimer (mcg/mL), IL-6 (pg/mL), random blood sugar (mg/dL), serum ferritin (µg/L), erythrocyte sedimentation rate (mm/h), urea (mg), serum creatinine (mg/dL), and pro-calcitonin (ng/mL) were recorded as a part of the hospital protocol.
Outcome parameters included demographic and clinical characteristics, comorbidities, symptoms, clinical and laboratory profile, causes of death, rate of mortality and its risk factors, which were compared between death cases in 2020 and 2021.
2.7.Statistical analyses
The analysis was done by SPSS software (IBM manufacturer, Chicago, USA, ver 21.0).The data normality was checked by using Kolmogorov-Smirnov test.Categorical variables were expressed as number and percentage, and quantitative data were expressed as median (IQR).For abnormally distributed data, we used nonparametric tests.Mann-Whitney U Test, Chi-square test, and Fisher’s exact test were used.Univariate and multivariate logistic regression was used to find out significant risk factors of mortality.The significant level of this study was set at α=0.05.
3.Results
3.1.Mortality rate
In the first wave, a total of 1 177 COVID-19 cases visited the hospital and 96 (8.2%) died.In comparison, the death rate in the second wave was significantly higher (244/2 038, 12.0%) (P<0.001).
3.2.Demographic and clinical characteristics
Compared to the first wave, death cases during the second wave had significantly higher incidence of category E (96.7% vs.80.2%, P<0.001), significantly shorter time gap between date of positive report and date of admission [1 (1-1) vs.1 (1-3.3), P=0.001)], significantly shorter duration between the date of starting ventilator and date of death [1 (0.2-2) vs.2 (1-4), P<0.001)]; while comparable age [60 (50-69) vs.60.5 (53-70), P=0.11], gender (P=0.34), and in-patient days in hospital (P=0.701) (Table 1).
3.3.Symptoms and comorbidities
Compared to the first wave, in the second wave there were significantly more death patients with fever (93.0% vs.60.4%, P<0.001), cough (92.6% vs.55.2%, P<0.001), loss of taste (13.5% vs.4.2%, P=0.012), loss of smell (13.1% vs.2.1%, P=0.001), weakness (91.4% vs.46.9%, P<0.001), sore throat (6.6% vs.1.0%, P=0.049) while comparable cases with breathing difficulty, vomiting, diarrhea, body ache, running nose, altered sensorium, and confusion and irritability (Table 2).
Compared to the first wave, in the second wave there were significantly fewer death cases with kidney disease (6.6% vs.13.5%, P=0.038), diabetes mellitus (35.7% vs.50%, P=0.015), and stroke (4.5% vs.10.4%, P=0.042).Other comorbidities were comparable as shown in Table 3.
3.4.Clinical and laboratory profile
Compared to the first wave, in the second wave there were significantly more death cases with abnormal X ray finding [196 (80.3%) vs.57 (59.4%), P<0.01], higher lymphocytes [14 (9-20) vs.12 (8-17), P=0.04], more proportion of patients with eosinophils count (P=0.01) and serum ferritin [672 (419.4-1 000) vs.492.8 (260.2-936.1), P=0.01], and significantly less CRP [83.1 (44.6-141.1) vs.125.7 (50.8-224.3), P<0.01], D-dimer [623.5 (298.3-1 227.8) vs.1 480 (922.8-6 090.0), P<0.01], TLC [7 670 (5 212.5-11 079.8) vs.10 400 (6 650-13 750), P<0.01], random blood sugar [156 (121.5-228.5) vs.186.0 (148.0-276.5], P<0.01), and erythrocyte sedimentation rate [36 (25-46) vs.68 (35-81), P<0.01] (Table 4).
3.5.Reasons for deaths
Reasons for deaths in the second wave were majorly bilateral pneumonia (100%), type-1-respiratory failure (97.5%), diabetes mellitus (34.0%), and hypertension (30.7%), while in the first wave were bilateral pneumonia (100%), type-1-respiratory failure (100%), diabetes mellitus (47.9%), and hypertension (36.5%) (Table 5).
3.6.Risk factors
For the first wave, univariate regression results showed that age, gender:-male, diabetes mellitus and abnormal X-ray were significant risk factors of mortality with odds ratio of 1.03, 1.21, 2.90, and 2.82, respectively; while multivariate regression results showed that age, diabetes mellitus and abnormal X-ray were significant independent risk factors of mortality with odds ratio of 1.10, 1.54, 3.156, and 2.67, respectively (Table 6).
For the second wave, univariate regression results showed that age, gender:-male, diabetes mellitus, abnormal X-ray, high D-dimer, and high IL-6 were significant risk factors with odds ratio of 1.07, 1.23, 9.62, 16.15, 13.15, and 6.98, respectively; while multivariate regression results showed that age, diabetes mellitus, abnormal X-ray, high D-dimer, and high IL-6 were significant independent risk factors with odds ratio of 1.13, 8.98, 12.83, 10.89, and 7.89, respectively (Table 6).

Table 1.Comparison of demographic and clinical characteristics between patients who died in the first wave and the second wave.

Table 2.Comparison of symptoms in COVID-19 patients between the first wave and the second wave.
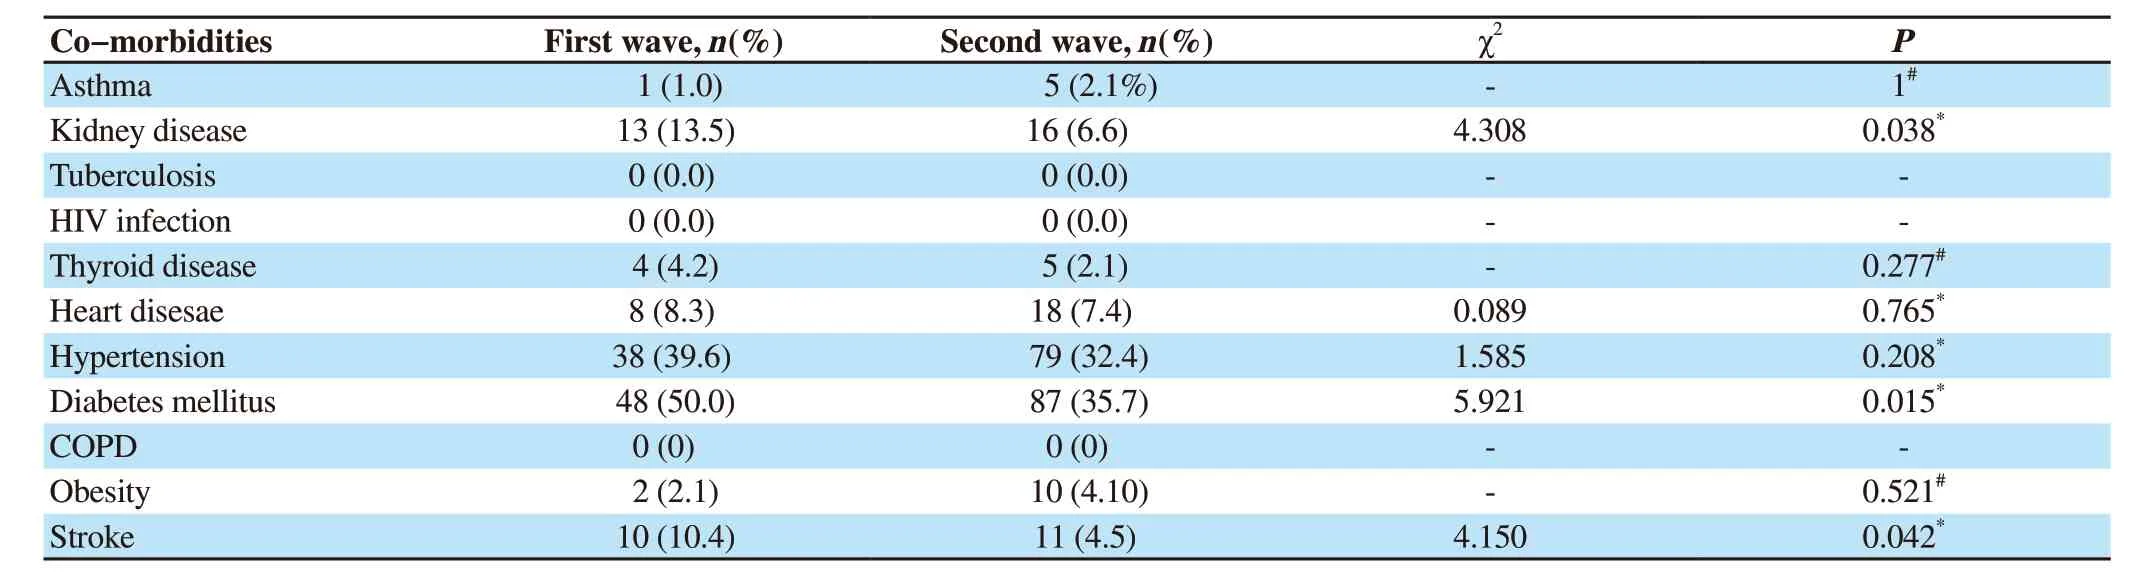
Table 3.Comparison of co-morbidities in COVID-19 patients between the first wave and the second wave.

Table 4.Comparison of clinical and laboratory profiles between patients who died in the first wave and the second wave.

Table 5.Comparison of causes of death between the first wave and the second wave.

Table 6.Univariate and multivariate logistic regression analysis of risk factors of mortality in the two waves.
4.Discussion
In Nagpur, India, the death rate in the second wave was significantly more than that in the first wave (12.0% vs.8.2%, P<0.001), along with an increased number of COVID-19 hospitalized cases in the second wave (2 038 vs.1 177).This is consistent with the findings by Kumar et al.[9], in which data of cases enrolled in the National Clinical Registry for COVID-19 was evaluated.It was found that there was an increase in the mortality in hospitalized patients by 3.1% during the second wave in India.Another Indian study that was conducted in north India also found mortality increased by about 40% in the second wave[10].
However, as mentioned by Jain et al.[11], compared to the first wave, there was no significant increase in the death rate in the second wave statistically; though due to the increased number of infections, the total number of death were high.The difference in findings of both studies could be attributed to Jain et al.[11] reported statistics in April, while we have considered the scenario up to May 2021.
Similar findings to our study were reported in a study by Jassat et al.[12], which was conducted in South Africa, as the occurrences of COVID-19 cases, admissions, and in-hospital mortality in the second wave outpaced the incidences in the first wave.
In contrast, in a study conducted in Spain by Iftimie et al.[2], it was found that more patients were admitted during the second wave; however, few deaths were reported.This difference in the number of deaths and improved findings of admitted patients may be associated with the fact that there is an improved healthcare system in Spain as compared to our country, Also, their country was better prepared and more experienced in the management of patients.In addition, more diagnostic tests were carried out, which allowed in the early detection and management of serious cases effectively.
Many factors could be accountable for the increased number of cases in the second wave in India.It was found that the mutant virus had a more effective transmission potential and a shorter incubation period.The public has shown a huge disrespect for “COVID-19 Appropriate Behaviours” and the quality of masks used varies greatly.Because of the higher costs, N-95 masks are not widely used in India, and the bulk of the population prefers to use either local masks made of cloth or the same worn-out masks.
The sharp increase can be attributed to the increased testing; however, concerns have been raised regarding the quality of testing, as numerous cases of positive COVID-19 symptoms were reported as negative on the RT-PCR test.
We observed that age, gender, and in-patient days in the hospital of patients who died in the second wave to be similar as that of first wave deaths.However, the second-wave deaths had significant category E, reduced duration from symptom onset to admission, indicating patients to be having a severe disease with short duration.
Kumar et al.[9] however, found that the mean age of the hospitalized patients was nearly 2 years less in the second wave than that in the first wave.Among the deceased patients in the second wave, there was increased mortality among all age groups except for those under the age of 20, among whom mortality declined.There was a lesser number of males in the second wave (63.7% vs.65.4%, P=0.02).There were significantly fewer days from symptom onset to admission in the second wave (3 days vs.4 days, P<0.001).On the other hand, Budhiraja et al.[10] found females to be admitted slightly more in the second wave, but age was similar in both waves.
Also, in a study by Iftimie et al.[2], it was found that patients admitted during the second wave were comparatively younger.This was consistent with the findings reported in previous studies from many countries[3,4,13].The causes for the clear disparities between the two waves are unknown.However, Iftimie et al.[2] mentioned that a new variant of SARS-CoV-2 emerged in early summer 2020 in Spain, a variant that was linked to outbreaks among young agricultural workers in the northeast of the country.Transmission to the general population in that area was then replicated across the country.
Other nations, like Germany[14], Japan[15], South Korea[16], and Iran[17], have observed a trend toward younger demographics in the second and following waves.
As mentioned in other similar studies also, young individuals’ failure to follow social distancing standards may have encouraged infection in young, healthy adults and children[3,18].
We found that in the second wave deaths, significantly more patients presented with fever, cough, loss of taste, loss of smell, weakness, and sore throat.In another Indian study by Kumar et al.,[9] the most common symptom was fever in both waves.Other symptoms such as sore throat, dry cough, muscle ache, fatigue, weakness, and loss of taste and smell were found in less number of patients in the second wave.In other countries, patients presented with similar symptoms.Iftimie et al.[2] reported that the most common symptoms of infection were fever, cough, dyspnea, and pneumonia; however, no difference was seen in both waves in these symptoms.But, more patients had renal (acute kidney failure) and gastrointestinal symptoms (vomiting, abdominal pain) in the second wave.
In the second wave, more patients showed breathlessness, which resulted in more usage of mechanical ventilation, oxygen supplementation, and increased mortality.One of the many factors could be a phenomenon of “silent hypoxemia” in COVID-19 patients, as those with hypoxia have no corroborating signs of breathlessness.This might have resulted in patients arriving at healthcare facilities with more disease severity.
In terms of comorbid conditions, second-wave deaths had significantly fewer patients with kidney disease, diabetes mellitus, and stroke.
Kumar et al.[9] found that the second wave cases had significantly fewer comorbidities.In another Indian study by Budhiraja et al.[10], it was reported that second wave cases had significantly more comorbidities (59.7% vs.54.8%, P<0.001), with a majority having diabetes or hypertension or both.
The study by Iftimie et al.[2], found a similar number of concomitant diseases in the two waves, which was consistent with findings by Iftimie et al.[19] On the contrary, a study conducted in Japan by Saito et al.[4] reported lesser occurrence of cerebrovascular and cardiovascular diseases.Similarly, in multicenter study in Italy by Di Castelnuovo et al.[20] the main predictors of in-hospital mortality were impaired renal function, but not obesity, cardiovascular disease, or cancer.
We found that the second wave deaths had significantly more abnormal X-ray findings, lymphocytes, and serum ferritin, and significantly less CRP, D dimer, TLC, random blood sugar, and ESR.This indicated increased disease severity as lung involvement was high with more X-ray findings.
The findings are consistent with other studies[11-20] as they showed lung involvement and increased inflammatory response that affects many tissues as well as organs.Also, lymphopenia causes increased levels of neutrophil to lymphocyte Ratio is associated with disease severity.
Our study was conducted at a single center and comparatively small geographical area, and its results cannot be generalized.However, the findings of the study are relevant as they may represent several similar centers in India and other developing countries, and there is currently little information accessible on this.
To sum up, the second wave had more overall mortality and severe disease than the first wave but affected a relatively similar demographic population in terms of age and gender.Symptoms such as fever, cough, loss of taste, loss of smell, weakness, and sore throat were more in the second wave, while other symptoms were similar in both waves.Patients presented with fewer comorbidities in the second wave.During the first wave, age, diabetes mellitus, and abnormal X-ray were significant independent risk factors of mortality, while in the second wave, age, diabetes mellitus, abnormal X-ray, high D-dimer, and high IL-6 were significant independent risk factors.
Conflict of interest statement
The authors report no conflict of interest.
Authors’ contributions
V.K.P., N.R.H., S.S.K., S.A.: Concept and design; V.K.P., N.R.H.; S.S.K.: Data collection, review of literature; V.K.P., S.S.K., S.A.: Drafting of manuscript; V.K.P., S.S.K., S.A.: Data analysis, statistics and data interpretation; V.K.P., N.R.H., S.S.K., S.A.: Intellectual input, critical revision and finalization of manuscript; V.K.P.: Guarantor.All authors provided final approval of version to be published.
 Journal of Acute Disease2022年2期
- Journal of Acute Disease的其它文章
- Electrocardiographic abnormalities in prevalent infections in tropical regions: A scoping review
- Goal-directed fluid therapy in gastrointestinal cancer surgery: A prospective randomized study
- Comparative study on effects of dexmedetomidine and dexamethasone on the incidence of postoperative nausea and vomiting in patients undergoing laparoscopic surgery
- Effect of cold weather on carotid artery stenosis and occlusion: A retrospective observational study
- Body mass index and COVID-19 outcomes: A retrospective crosssectional study at a tertiary care center in India
- An alveolate kidney: A case report of emphysema pyelonephritis